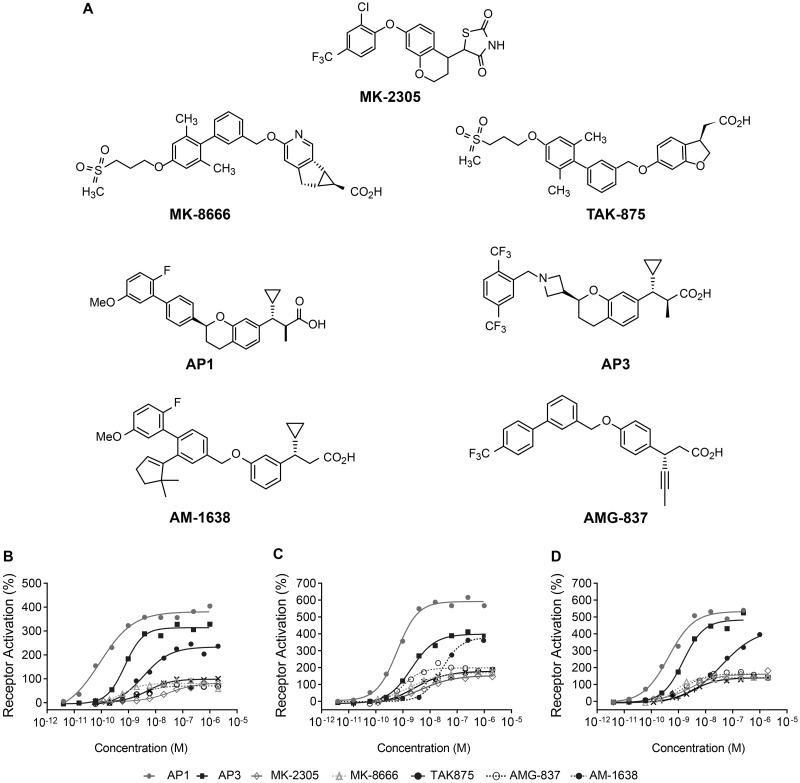
Fig 1. Chemical structures and measurement of IP accumulation in stable cell lines expressing human, rat, or mouse GPR40.
(A) Chemical structures of partial agonists MK-8666, MK-2305, TAK-875, AMG-837; and AgoPAMs AM-1638, AP1, and AP3. Dose-response curves for partial agonists (MK-8666, MK-2305, TAK-875, and AMG-837) and AgoPAMs (AM-1638, AP1, and AP3) were generated in human GPR40/CHO-K1 (B), rat GPR40/HEK293 (C), or mouse GPR40/HEK293 (D) cells. Data are expressed as a percentage of the control response of an in-house partial agonist and fitted to a standard 4-parameter non-linear regression model. EC50’s were determined using a custom in-house developed software package. Each compound was profiled multiple times (n = 2–20) with representative graphs shown. The mean parameters of these are shown in Table 1.

