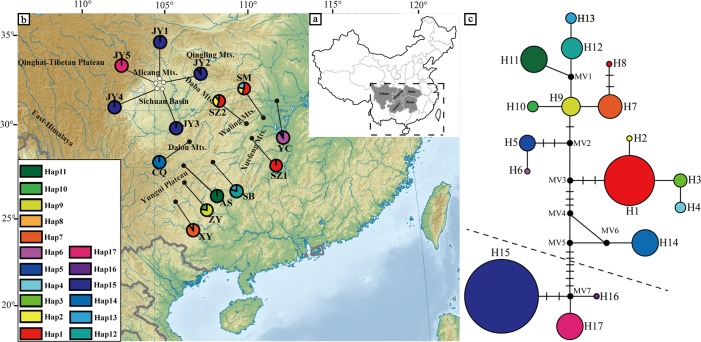
Fig 2. Geographical distribution of cpDNA and NETWORK-derived genealogical relationship.
(a) Distribution ranges of U. henryi and U. rockii. (b) The distributions of cpDNA haplotypes (H1–H17) detected in U. rockii and U. henryi (population codes see Table 1). (c) The statistical parsimony network of cpDNA haplotypes (H1–H17). The topographic map is from the website https://en.wikipedia.org/wiki/File:East_Asia_topographic_map.png.

