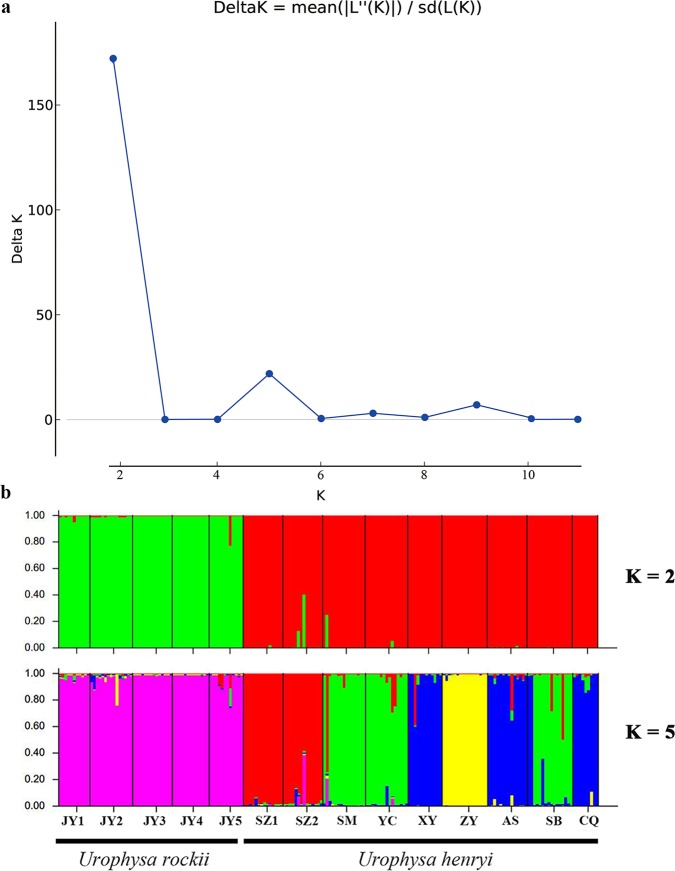
Fig 5. Bayesian clustering analysis for the species of Urophysa inferred by STRUCTURE.
(a) Bayesian inference of the cluster number (K). (b) Results for clusters (K = 2 and 5) as detected by STRUCTURE. K was estimated using the distribution of ΔK (second order rate of change of the likelihood distribution). The bars on the figure represent these individuals were sampled from the same species. Bar plots showing Bayesian assignment probabilities. Each vertical bar corresponds to one individual. Populations are separated by black bars and identified at the bottom.

