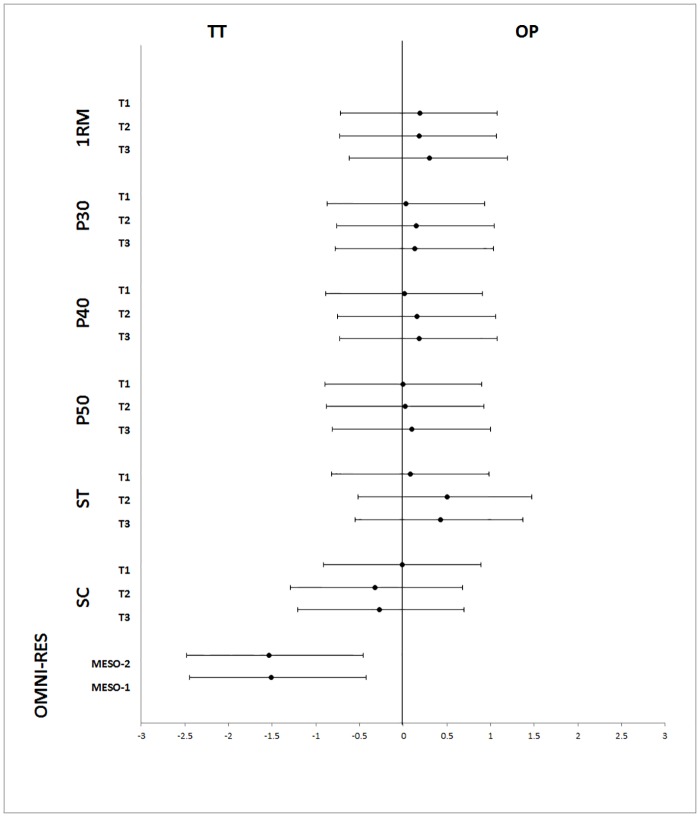
Fig 2. Forest plots of effect sizes for all variables at three points of assessment.
Results are expressed as Cohen’s d with 95% confidence intervals (CIs). OP = optimum power group; TT = traditional training group; T1 = pre-intervention evaluation; T2 = evaluation after first four weeks’ training; T3 = post-intervention evaluation; 1RM = one repetition maximum; P30 = peak power output with 30% of 1RM; P40 = peak power output with 40% of 1RM; P50 = peak power output with 50% of 1RM; ST = salivary testosterone; SC = salivary cortisol; MESO-1 = mean value of OMNI-RES scale punctuation for first four weeks’ training; MESO-2 = mean value of OMNI-RES scale punctuation for second four weeks’ training.

