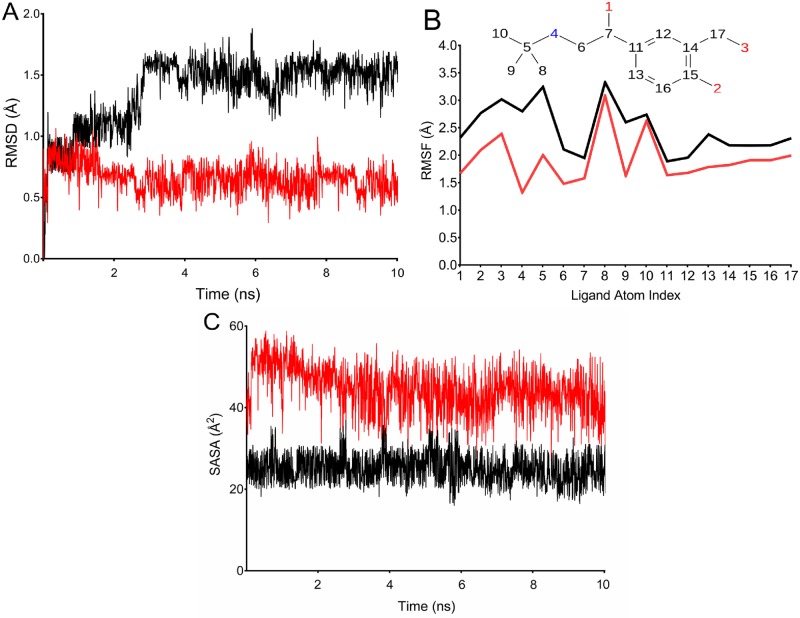
Fig 6. Trajectory analysis of salbutamol in complex with wild and T164I β2AR.
(A) RMSD of salbutamol with respect to the reference conformation in wild and T164I β2AR. (B) ‘Fit on protein' line shows atomic fluctuations (RMSF) with respect to the receptor. Corresponding atoms of salbutamol is shown as 2D structure in the top panel. (C) Solvent accessible surface area of salbutamol in course of simulation. Trajectory lines for wild and T164I β2AR are represented in red and black color respectively.

