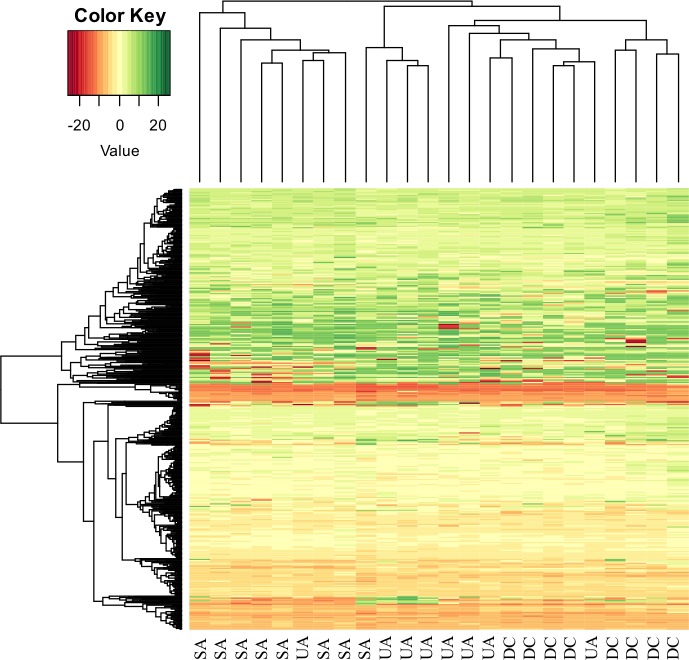
Fig 1. Unsupervised hierarchical clustering analysis using the differentially expressed microRNAs separates SA, UA, and control tissues.
The heatmap (Euclidean distance) represents the delta-Ct values. Color heatmap correspond to microRNA expression as indicated in the color key: red (underexpressed) and green (overregulated).

