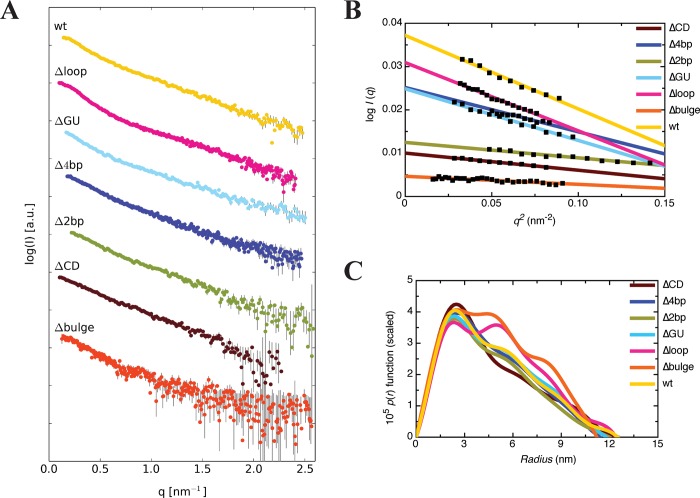
Fig 5. Characterization of wt RNA and CS mutants by SAXS.
(A) SAXS scattering profiles, where each dataset represents the merged raw data from multiple sample concentrations. (B) A dotted line was fitted through the data at the low-q region of a plot of log I(q) vs. q2 (Guinier analysis) with an upper limit for q.rG of 1.3 to obtain rG from the slope for wt and mutant RNAs. (C) Dependence of the pair distribution function om the particle radius for each of the samples outlined in (A).

