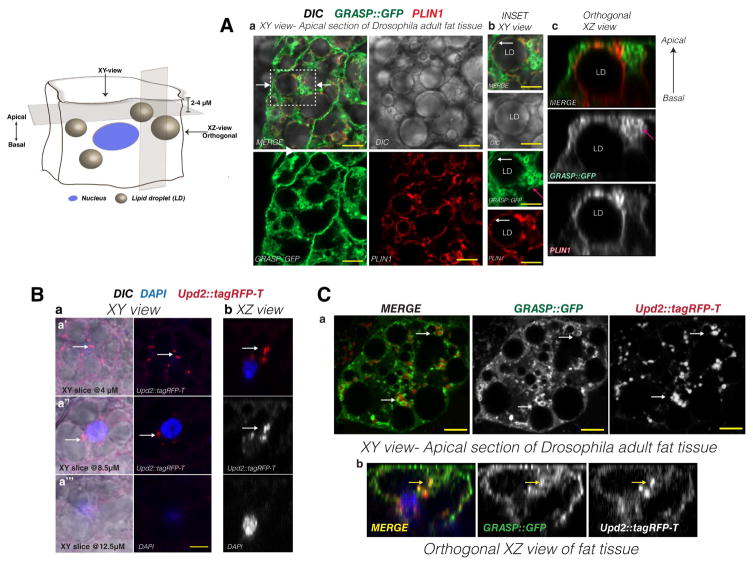
Figure 6. Distribution of tagged GRASP and Upd2 in adult Drosophila fat cells.
Diagram depicts the orientation (XY and XZ) and depth of apical sections (2–4μM) during laser scanning confocal acquisition. Note ‘Apical’ refers to the surface of the fat cell that is in contact with the lumen and hemolymph, and ‘Basal’ is the side of the fat cell which is attached to the cuticle. See diagram in companion Figure S5A for adult Drosophila fat tissue preparation used for imaging.
(A) Single optical section of Drosophila adult fat tissue expressed GFP tagged GRASP (green) stained with anti-perilipin1 (PLIN1) antibody (red). PLIN1 is used as a marker for lipid droplet (LD) surface. (a) Confocal image of a single optical section along the XY axis at the apical side of adult Drosophila fat cells expressing GFP tagged GRASP. Note the wide cytoplasmic distribution of GRASP (see S5B). Box is location of inset shown in (b) and arrows point to location where XZ slice (c) was acquired. GRASP exhibits a wide cytoplasmic distribution, but exhibits specificity in its localization to LD periphery. Note that control myristoylated GFP proteins do not exhibit this localization (S5C) and that GRASP also forms ‘clusters’ in the most apical sections. (b) High magnification view to show clusters (pink arrow) and LD peripheral localization (white arrow) of GRASP (c) Orthogonal YZ axis view of GRASP localization. Note the concentration of GRASP ‘clusters’ on the apical side of the cell (pink arrows) while PLIN1 displays approximately equal distribution from basal to apical.
(B) (a) Confocal micrograph representing XY view of fat cells expressing Upd2::tagRFP-T (red), nucleus (blue), DIC reveals LD. White arrows point to Upd2 punctae. XY serial sections from apical (a′) at 4μM depth from the top of the cell to basal (a‴) at a depth of 12.5μM. (b) YZ slice orthogonal view. Note that the Upd2 punctae are enriched at a plane above the nucleus.
(C) Confocal micrographs of optical sections of adult fat tissues expressing tagged Upd2 and GRASP (Upd2::tagRFP-T in red, GRASP::GFP in green, and nucleus in blue). (a) XY view of fat cell at 4μM depth. Upd2 punctae appear in the proximity of GRASP enriched regions. (b) Orthogonal view along the XZ axis. Arrow points to the co-localization of GRASP and Upd2 in a sub-apical location above the plane of the nucleus.
In micrographs 6A–C, yellow scale bar represents 5μM. See also Figure S5.

