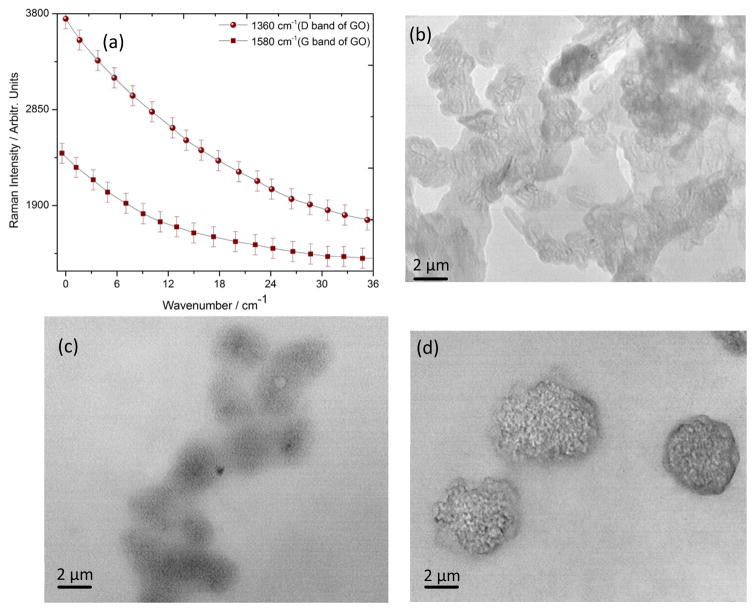
Figure 6.
(a) Critical monitoring of GO internalization with respect to incubation time based on ‘D’ and ‘G’ band Raman intensity of graphene oxide under 532 nm laser excitation. (b) Transmission electron microscope image of bio-conjugated graphene oxide and SKBR3 solution mixture just after 2 minutes of incubation. (c) Transmission electron microscope image of bio-conjugated graphene oxide and SKBR3 solution mixture after 5 hours of incubation. (d) Transmission electron microscope image of bio-conjugated graphene oxide and SKBR3 solution mixture after 24 hours of incubation indicates accumulation of bio-conjugated graphene oxide on the cell membrane surface.

