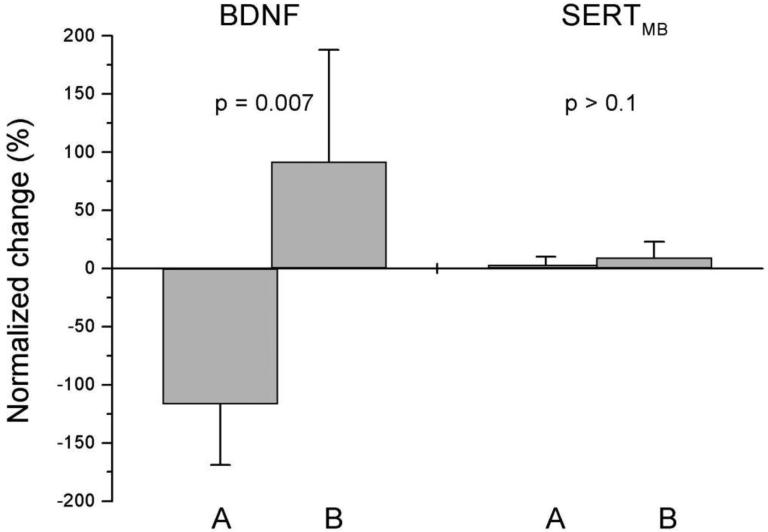
Figure 1.
Change in serum brain derived neurotrophic factor concentrations (BDNF) and in serotonin transporter binding in midbrain (SERTMB), in two groups with different clinical responses to fluoxetine, according to the Autism Treatment Evaluation Checklist Section Two, Socialization. Group A (good responders, n = 6) had the best clinical response, while group B (poor responders, n = 7) had less beneficial clinical effect. Error bars indicate the standard deviations (SD). The difference of BDNF between the groups was significant. Normalized change was calculated as follows: 100 % (treatment – baseline) / 0.5·(treatment + baseline).

