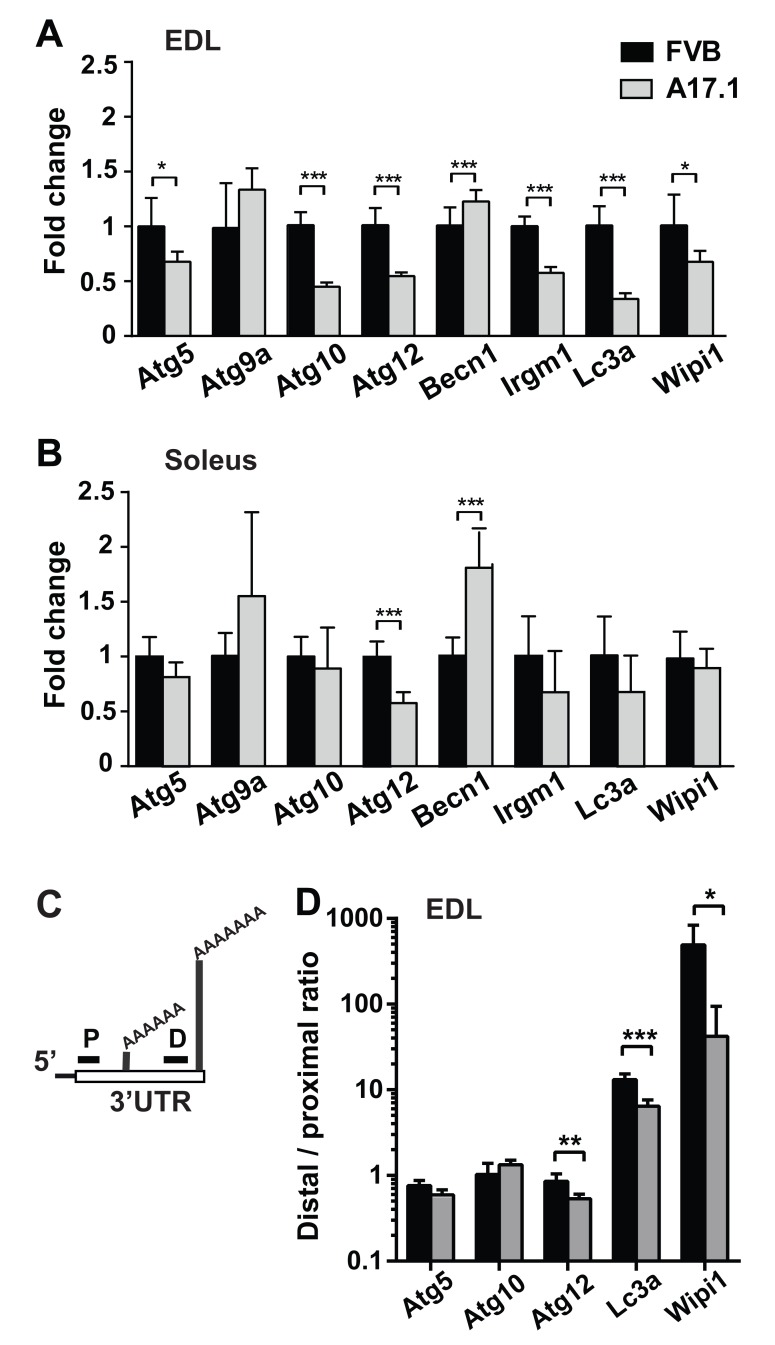
Figure 1. ATGs mRNA expression in the OPMD mouse model, A17.1.
A.-B. Bar charts show results from RT-qPCR experiments of eight ATG in EDL (A) or Soleus (B) muscles of A17.1 (grey bars) and FVB control mice. Expression fold change was calculated by normalisation to Hprt housekeeping gene and FVB control. C. Schematic presentation of PCR analysis of PAS utilization in the 3’UTR. Two primer sets were used: a distal set (D) amplifies long transcripts from the distal PAS, and a proximal set (P) that additionally amplifies short transcripts with proximal PAS. APA utilization is calculated from the ratio Distal to Proximal. D. Bar chart shows distal to proximal ratio for five ATG in EDL. Averages and standard deviations are from five mice. Student’s T-Test was used to assess statistical significance (0.05<p <0.01 (*); 0.01<p<0.005 (**) P <0.005 (***).

