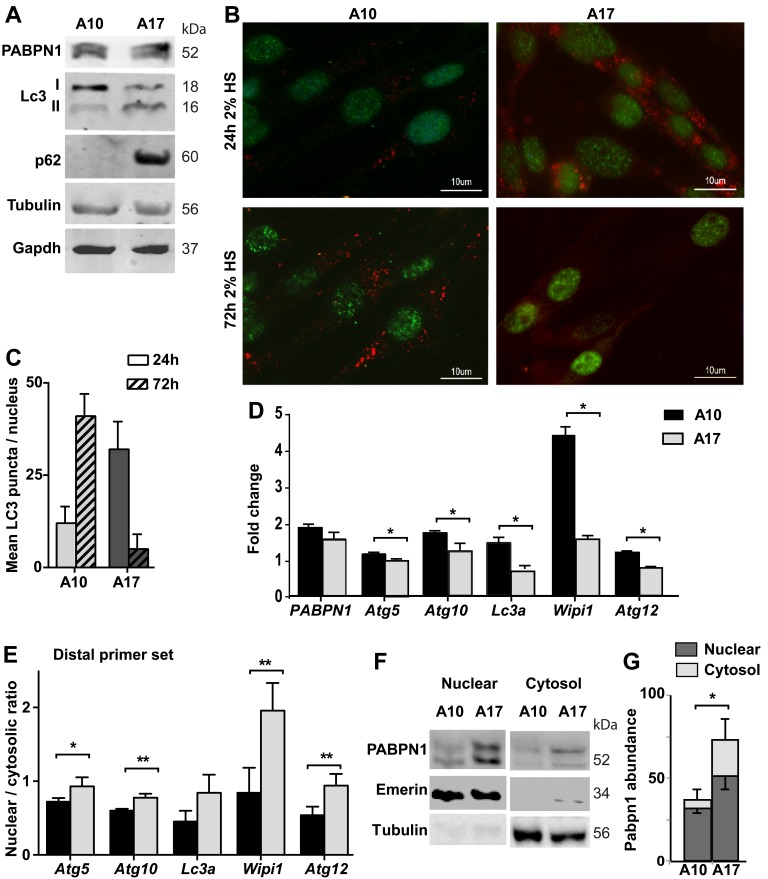
Figure 4. Autophagy is hyper activated in OPMD muscle cell model.
Experiments were performed in stable muscle cell culture over-expressing wild type PABPN1 (A10) or expPABPN1 (A17). The expression of PABPN1 transgenes was induced by incubation with 2% HS. A. Western blot shows levels of transgenes A10 and A17 PABPN1-FLAG (55 kDa) and endogenous Pabpn1 (52 kDa). Autophagy activation is represented by LC3II and P62. Tubulin and Gapdh are used as loading controls. B. Images of representative immunofluorescence with anti-FLAG (green) and anti-LC3 (red) antibodies in cell cultures that were incubated with 2% HS for 3 hours or 48 hours. Scale bar is 10 µm. C. Chart bar shows mean LC3 puncta per nucleus in A10 or A17 culture. Mean and standard deviations are from 100 nuclei collected from three independent experiments. D. Bar chart shows mRNA levels of five ATG in A10 or A17 cultures. Fold change was obtained after normalisation to Hprt housekeeping gene and to parental culture. E. Bar chart shows the nuclear to cytosolic ratio of ATG transcripts from the distal primer set. F. Image shows a representative Western blot of nuclear and cytosolic fractions, marked by Emerin or Tubulin, respectively. G. Bar chart shows PABPN1 abundance in nuclear or cytosolic fractions in A10 or A17 cell cultures. PABPN1 abundance was calculated after normalization to loading control in each fraction. Averages and standard deviations are from 4 replicates. Averages and standard deviations are from three biological independent cultures. Statistical significance is assessed by the Student’s T-Test (p < 0.05 is denoted with *; p < 0.005 is denoted with **).

