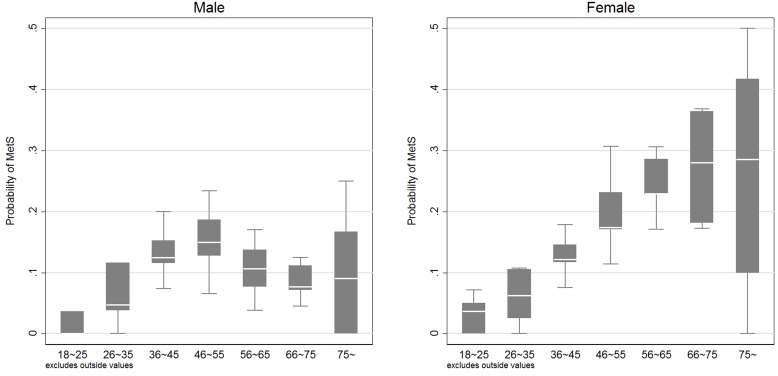
Figure 2. Real prevalence of having metabolic syndrome at each age group.
Left panel: prevalence of MetS at each age group for male. Right panel: prevalence of MetS at each age group for female. The Boxes are the 75th and 25th percentiles, and the white line within the box is the median value. Two gray horizontal lines refer to the upper and lower adjacent values. The upper adjacent value = 75th percentile+1.5×(75th percentile-25th percentile), and the lower adjacent value = 25th percentile-1.5×(75th percentile-25th percentile). Outside values, which are defined as those greater than the upper adjacent value or smaller than the lower adjacent value, are excluded from the box graph.

