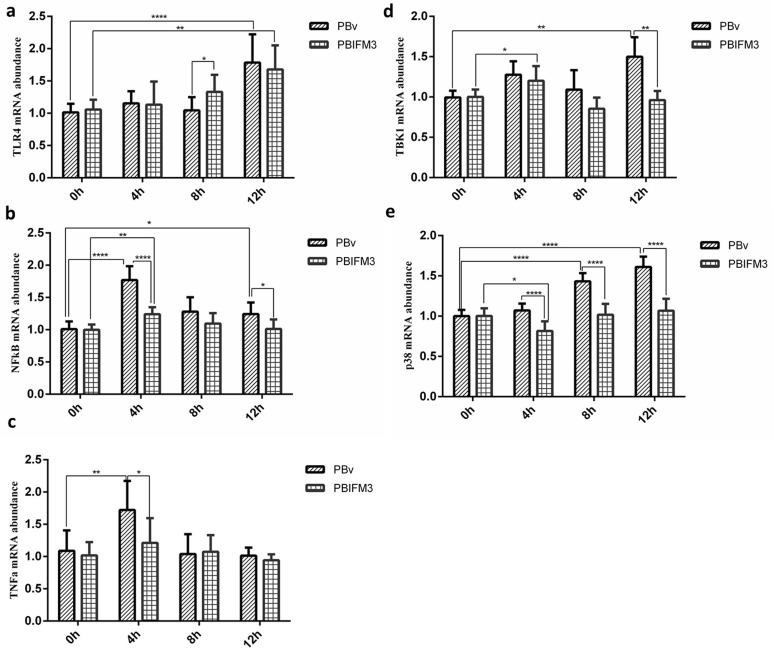
Figure 7. Effect of swine IFITM3 on the expression of components of the TLR4 signaling pathway.
Graphs demonstrate the expression of TLR4 (a), NFκB (b), TNFα (c), TBK1 (d) and p38 (e) in PBIFM3 and PBv cells stimulated with or without LPS (100 μg/ml). In LPS groups, cells were incubated correspondingly with LPS (100 μg/mL) for 4, 8, 12 h. Cells in 0 h (control) group were cultured in basal medium. *P < 0.05,**P < 0.01, ****P < 0.0001 vs. PBv or 0 h group.

