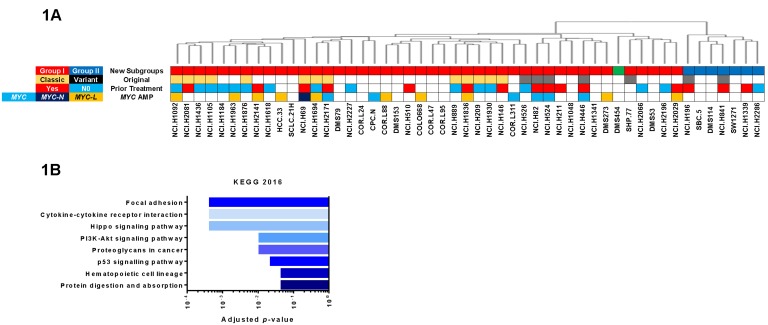
Figure 1. Identification of subgroups in SCLC cell lines.
A. Dendrogram at top reproduced from reference 6. Colored bars on top indicate whether cells are members of Group I (red), Group II (blue) or Group III (green). Original classification of cells by Gadzar and Minna given below, when available [7]. Prior treatment with drug or radiation extracted from reference [36]. MYC amplification determined from COSMIC database. Blank (white) boxes indicate no value found. B. Results of Enrichr analysis of 132 significant genes that were increased 1.5-fold in Group II cell lines.

