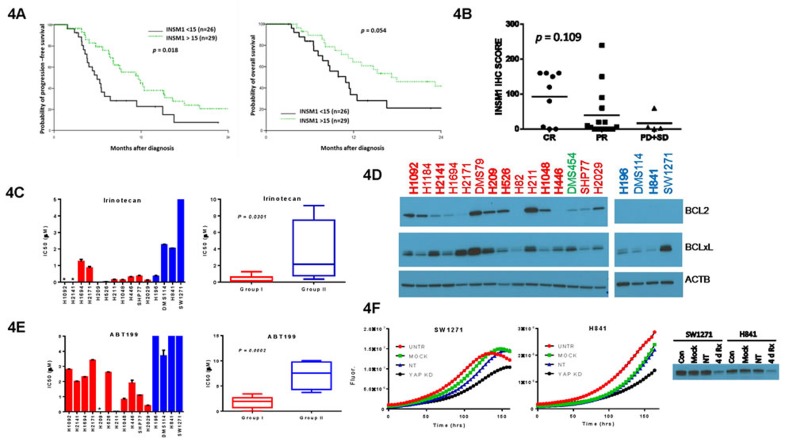
Figure 4. Chemo-sensitivity of SCLC subgroups.
A. Survival analysis based upon INSM1 IHC scores from the second TMA. Restricted to those patients with OS ≥ 3 mo. The median INSM1 expression score was 15 (range: 0 - 240) and the mean was 51 (STD: 70.9). B. Correlation of INSM1 IHC score with chemo-response (N = 28) in the second TMA cohort. Response was graded as complete response (CR), partial response (PR), progressive disease (PD) or stable disease (SD) using RECIST criteria. Mean IHC values are shown by horizontal bars. C. IC50 values for irinotecan inhibition of cell growth listed for individual cell lines (left) as well as for cell line subgroups (right). Individual cell line IC50 values represent mean ± SEM of 1-2 independent experiments and are shown as either red (Group I) or blue (Group II) bars depending on their subgroup assignment. Cells are arranged on x-axis, left to right, in identical order to the clustering diagram in Figure 1A. *Cell line not tested. Boxplots represent mean ± SEM of individual IC50 values for a Group with p values showing significance between Groups. D. Western blot of cell lysates shown as in Figure 2F but probed for BCL2 and BCLxL. E. Same as in panel C except for ABT199. F. Growth curves for SW1271 and H841 cells after knockdown by 500 nM YAP1 siRNA (KD) or non-targeting siRNA (NT) compared to untreated (CON) or mock-transfected cells. Bottom shows western blot validating YAP1 knockdown after 4 days of treatment.

