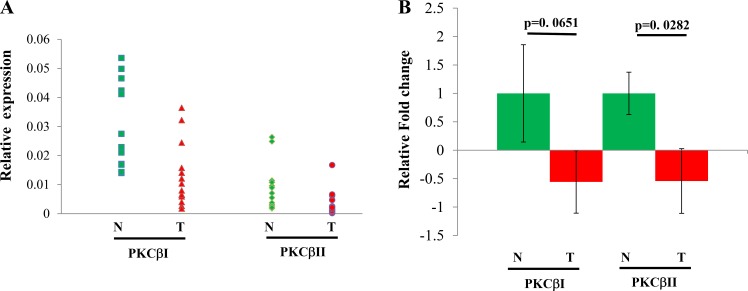
Figure 5.
Individual (A) and combined (B) expression analyses of PKCβ isoforms in fifteen pairs of HCC and normal liver tissues by q-PCR. Total RNA from individual samples were subjected to real-time RT-PCR analysis to detect the mRNA expression of PKCβ-I and PKCβ-II. β-Actin was used as an internal control to normalize the samples. Data was analyzed using the delta delta ct method. The results were shown as mean ± SEM. All statistical analyses were performed by Student’s t-test or ANOVA in Excel; p < 0.05 was considered statistically significant. *< 0.05.

