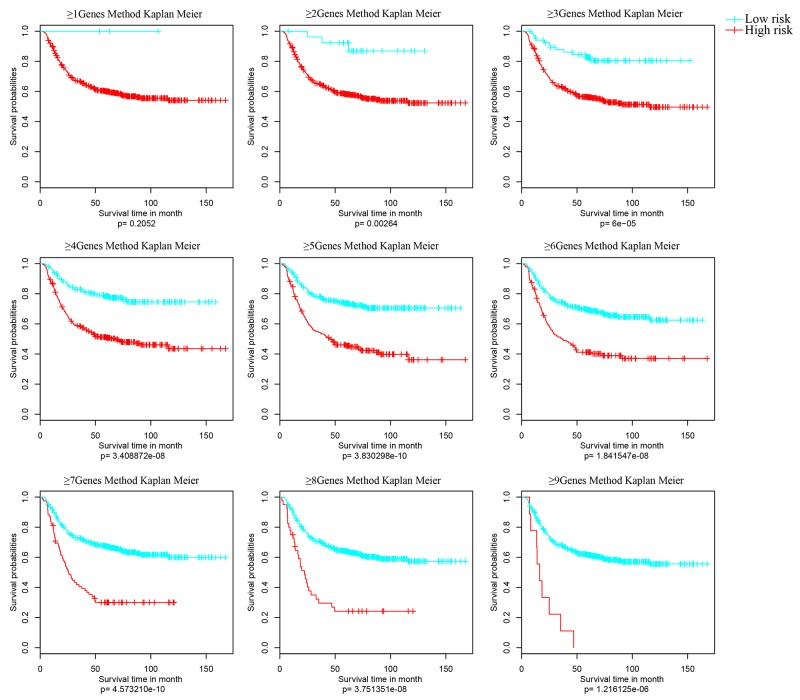
Figure 5. Kaplan Meier survival analyses of different clusters.
Samples were grouped basing on the activated impact factors of every sample (≥1, ≥2, ≥3, ≥4,…>9) into high risk (curve in red) and low risk (curve in blue). And significant p value of the corresponding cluster was obtained in Kaplan Meier univariate survival analysis. The survival time is calculated by month. The threshold is p value < 0.05.

