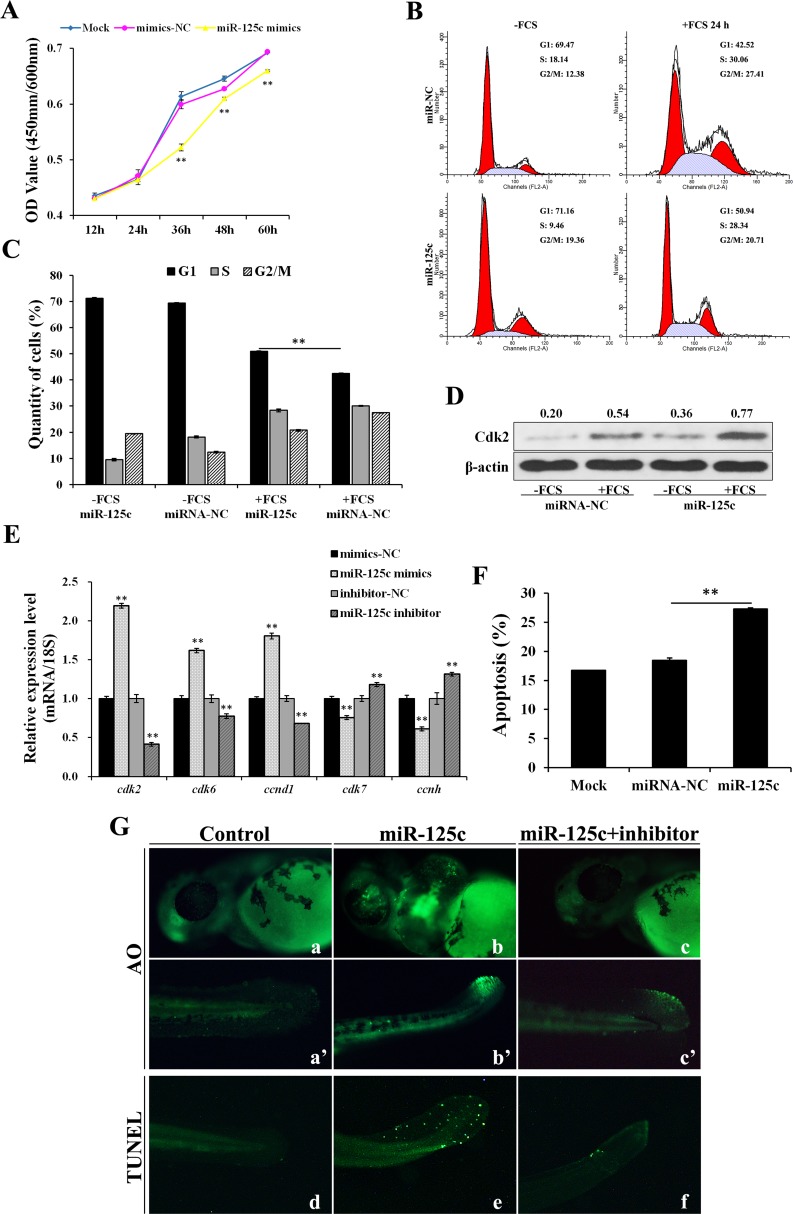
Figure 3. miR-125c represses cell proliferation through cell-cycle arresting at G1 phase and induces cell apoptosis.
(A) ZF4 cells were transfected with miR-125c mimics (mimics-NC, negative control), and cell proliferation index was continuously detected using CCK-8 assays kit. Mock represents transfection control. All of the values represent the means ± S.D. (n = 3, **P < 0.01). (B) After 24 h transfection with miR-125c mimics (miR-NC, negative control), ZF4 cells were synchronized in G0/G1 by FCS starvation for 35 h (-FCS) and launched into cell cycle process by FCS addition for another 24 h (+FCS). The cell cycle analysis was performed in triplicate by flow cytometry. The data correspond to the mean of three independent experiments. (C) Percentage of ZF4 cells in G1, S, and G2/M phase were determined. The results are presented as means ± S.E. (n = 3, **P < 0.01). (D) Expression analysis of Cdk2 protein by Western blot in corresponding ZF4 cell samples. β-actin is used to normalize protein levels. Numbers indicate quantification of the Cdk2 band densities relative to β-actin. (E) Expression analysis of cell cycle genes cdk2, cdk6, ccnd1, cdk7 and ccnh in ZF4 cells transfected with miR-125c mimics (mimics-NC, negative control for mimics) or inhibitor (inhibitor-NC, negative control for inhibitor). 18s rRNA is used as the endogenous control. Values represent means ± S.D. (n = 3, **P < 0.01). (F) Percentage of apoptosis in ZF4 cells transfected with miR-125c mimics (miR-NC, negative control) was determind by Annexin V-FITC/PI staining and flow cytometry. Mock represents transfection control. The results are represented as means ± S.E. (n = 3, **P < 0.01). (G) Detection of cell death and apoptosis phenotypes in miR-125c injected zebrafish embryos at 48 hpf by AO staining (a-c and a’-c’) and TUNEL assays (d-f), respectively. Injection of miR-125c mimics together with inhibitor was performed to determine whether knockdown of miR-125c can rescue the apoptosis phenotype.

