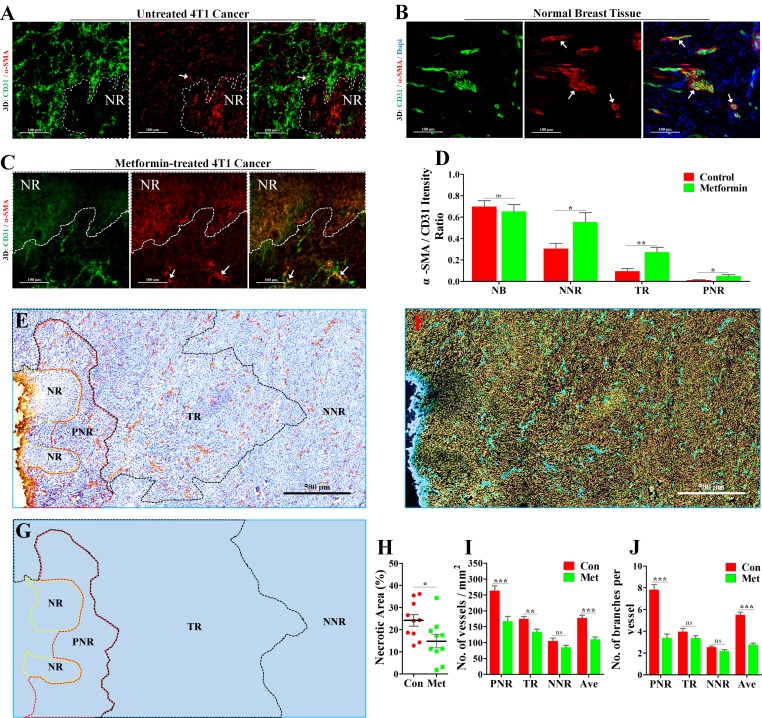
Figure 3. Increase of vascular maturity contributed to metformin-induced reduction of necrosis and MVD.
4T1 tumor-bearing BALB/c mice were orally treated with metformin (1.5 mg/mL) for 21 days before extraction. The wholly extracted 4T1 tumors were fixed by 4% paraformaldehyde and cut into 40μm thick frozen section for further 3D-reconstruction of immunofluorescent signal. 3D-reconstruction of fluorescent signal of CD31 (Green) and α-SMA (indicating vascular smooth muscle cell, VSMCs) in (A) untreated 4T1 tumor (Con), (B) normal breatst tissue and (C) metformin-treated 4T1 tumor (Met). α-SMA signal co-located with CD31 signal indicate VSMCs that covered the tumor vascular lumen. (D) Quantification of ratio of co-located fluorescent α-SMA to CD31 in NB (normal breast), PNR (peri-necrotic region), TR (transitional region) and NNR (non-necrotic region). Scale bar: 100 μm. (E) Representative image (Immunological Histological Chemistry) for showing CD31+ vessels distributed in peri-necrotic region, transitional region and non-necrotic region of metformin-treated 4T1 tumor. Scale bar: 500 μm. (F) The color-reverse image and (G) regional distribution map of panel (E) for revealing angiogenic ability of vessels distributed in different regions of metformin-treated tumor. Scale bar: 500μm. The peri-necrotic and non-necrotic regions were surrounded by red and yellow dotted lines, respectively. (H) Quantification of percentage of necrotic area in 4T1 tumors from untreated or metformin-treated BALB/c mice (n = 10). Quantification of (I) microvessel density (MVD, No. of vessels per mm2) and (J) vascular branch density (No. of vascular branches per vessel) of different regions in 4T1 tumors from untreated or metformin-treated BALB/c mice (n = 10). Quantitative data are indicated as mean ± SEM. *p < 0.05; **p < 0.01; ***p < 0.001; ns indicates no significant (P > 0.05).

