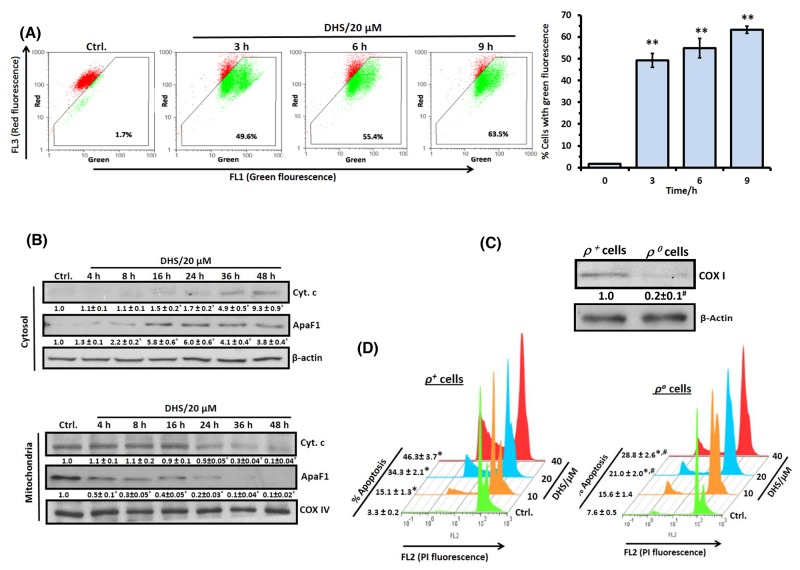
Figure 3. DHS permeabilizes mitochondrial membrane of IMR32 cells to induce apoptosis.
(A) Flow cytometry analyses of ΔΨm. The cells were incubated for different periods with DHS (0 and 20 μM), stained with JC-1 for 15 min, and ΔΨm loss quantified by flow cytometry from the increased green fluorescense. (B) ApaF1and cyt. c translocation. The cytoplasmic and mitochondrial cell extracts were respectively subjected to immunoblotting, using suitable antibodies against ApaF1 and cytochrome c. (C) Mitochondria depletion in cells. The IMR32-ρo cells were prepared and the mitochondrial DNA deficiency was assessed from the COX I expressions in the ρ+ and ρo cells. The protein bands in the immunoblots were detected using a Kodak Gel-doc software and the intensity ratios of the individual bands to that of IMR32-ρo control, taken as 1 (arbitrary unit) were quantified after normalizing with respective loading controls. (D) Increased sensitivity of the IMR32-ρo cells to DHS treatment. The ρ+ and ρo cells were incubated with different concentrations of DHS (0-40 μM) for 48 h, and the sub-G1 cell populations analyzed by flow cytometry. All determinations were made in duplicates for immunoblots and five replicates for flow cytometry analyses in 3-4 different experiments. The values are mean ± S. E. M. *p<0.05, **p<0.01 compared to respective vehicle controls; #p<0.01 compared to ρ+ cells. Representative dot plots, histograms and images are shown.

