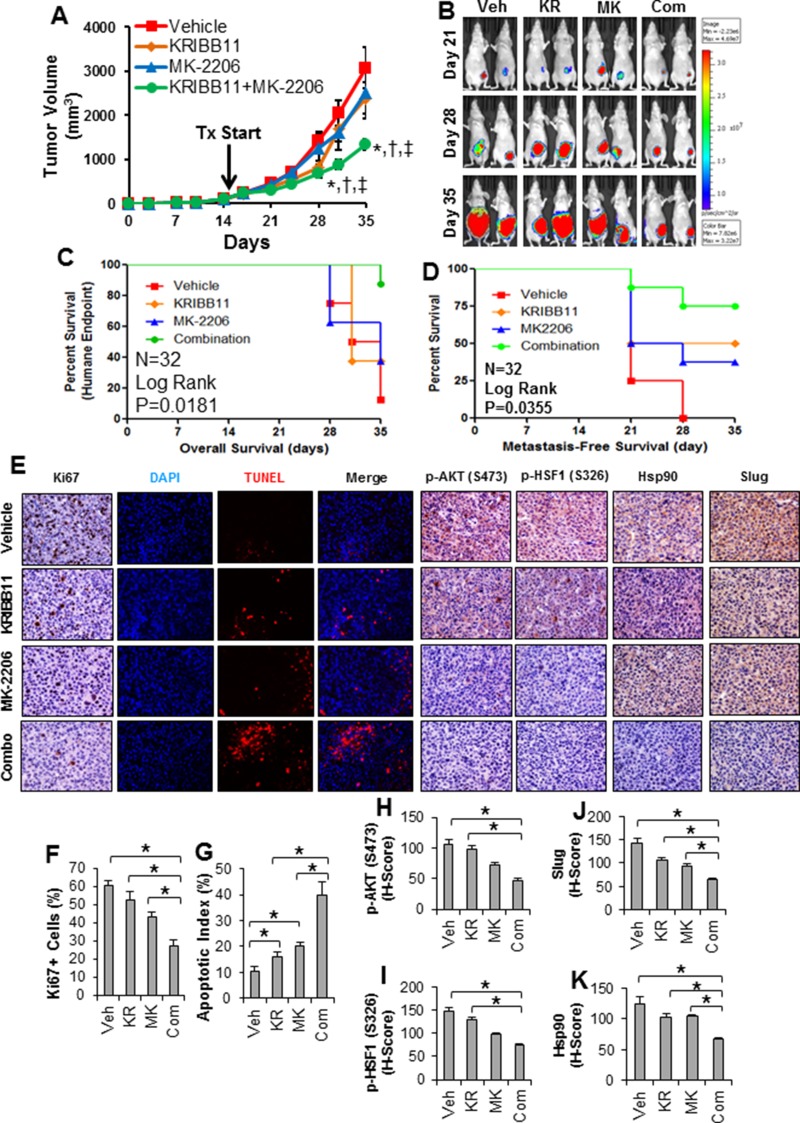
Figure 6. Combination of HSF1 and AKT inhibition reduces growth and metastasis of triple-negative breast cancer in vivo.
(A) Nude mice were subjected to mammary fat pad implantation of 1 × 10⁵ MDA-MB-231 cells and once tumors reached 102.9 ± 8.4 mm3 (day 15) mice were randomized to vehicle, KRIBB11 alone, MK-2206 alone, or KRIBB11+MK-2206 (n = 8 mice/grp). Tumor volume was measured twice per week. Significant differences were determined by ANOVA. *Indicates significant difference compared to vehicle (p < 0.05). †Indicates significant difference compared to KRIBB11 alone (p < 0.05). ‡Indicates significant difference compared to MK-2206 alone (p < 0.05). (B) In vivo luciferase imaging of representative tumors throughout the treatment period. (C) Kaplan–Meier curve was generated from overall survival (or reaching of the humane endpoint of 1500 mm3 tumor volume) of mice throughout the experiment. Trend significance was determined using the Log Rank test. (D) Kaplan–Meier curve was generated based on time to metastasis as determined by isolated luciferase imaging of the mice upper body. Significance was determined using the Log Rank test. (E) Formalin-fixed and paraffin-embedded tumors from each treatment group were subjected to IHC for Ki67, p-AKT (S473), p-HSF1 (S326), Hsp90, Slug, and TUNEL assay. Displayed are representative images from each treatment group for each antibody, DAPI, TUNEL, and DAPI-TUNEL merged. (F) Quantification of the percentage of Ki67+ cells in each treatment group (n = 8/grp). (G) Quantification of apoptotic index for each treatment group. (H–K) H-scores of IHC were determined for each treatment group for p-AKT (H), p-HSF1 (I), Slug (J), and Hsp90 (K). Veh=vehicle; KR=KRIBB11; MK=MK-2206; Com=Combination.

