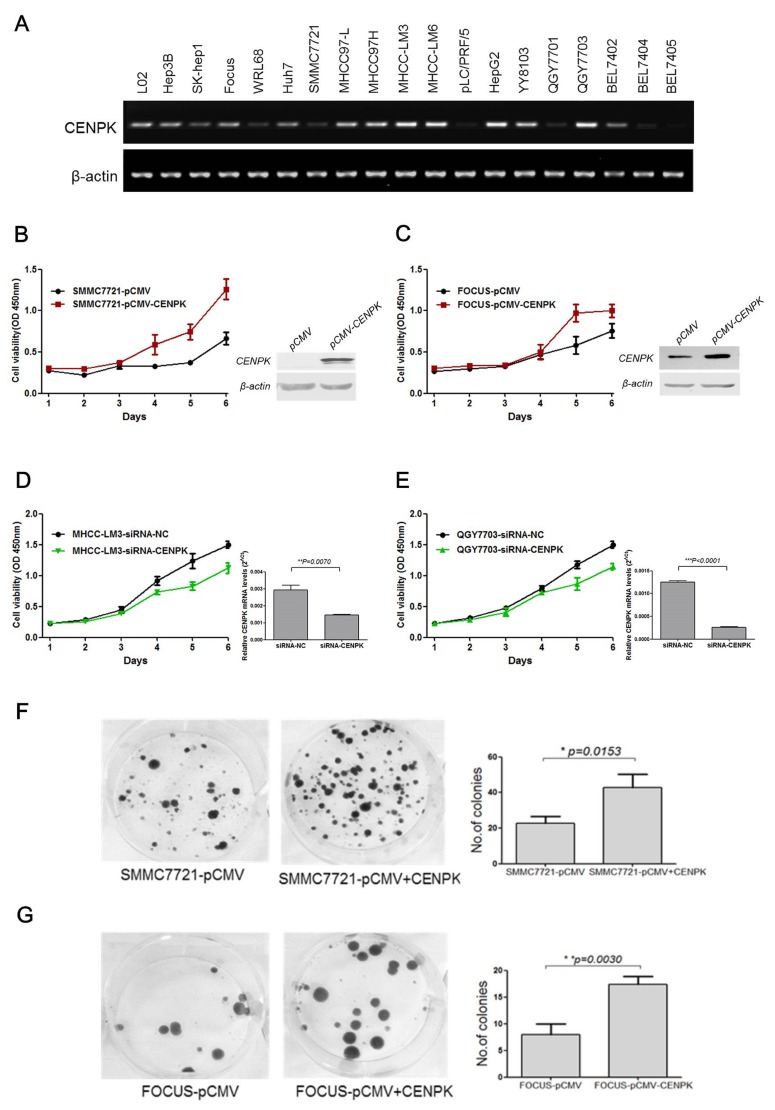
Figure 2. The effect of CENP-K on the growth and colony formation of HCC cells.
(A) Semi-quantitative RT-PCR analysis of CENP-K in 19 HCC cells; (B and C) CENP-K was significantly overexpressed in SMMC7721 and Focus. Blank vector pCMV was used as a negtive control. The growth curves were determined by the CCK-8 assay; (D and E) CENP-K was knockdown in MHCC-LM3 and QGY7703. SiRNA-NC was used as a negtive control. The growth curves were determined by the CCK-8 assay; (F and G) CENP-K was significantly overexpressed in SMMC7721 and Focus. Blank vector pCMV was used as a negtive control. After transfection for 24 hours, the cells were scraped and plated on dishes and cultured in G418 for 2 weeks. The representation dishes showed that CENP-K promoted the colony formation. The histogram showed that the colony formation was promoted by CENP-K, compared with the vector-only control. All the expriments were repeated at least three times and the spots represent the average values, with standard deviations (SDs) included for each mean value.

