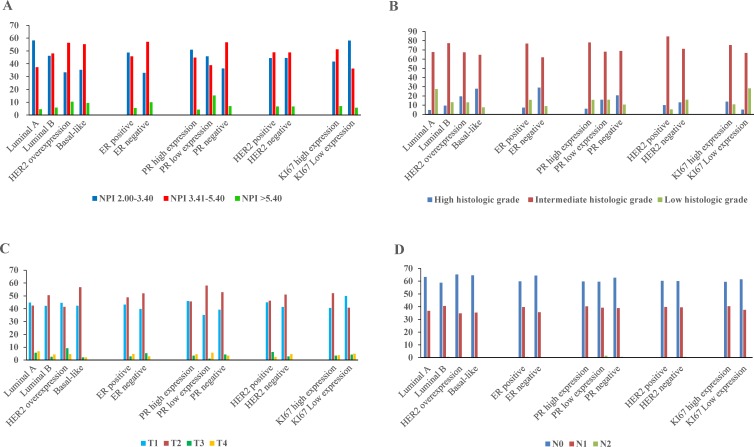
Figure 1. The distribution of NPI variables in molecular subtypes and its sub-factors.
(A) The proportion of NPI scores in molecular subtypes and its sub-factors. (B) The proportion of histological grades in molecular subtypes and its sub-factors. (C) The proportion of tumor sizes in molecular subtypes and its sub-factors. (D) The proportion of lymph nodes in molecular subtypes and its sub-factors.

