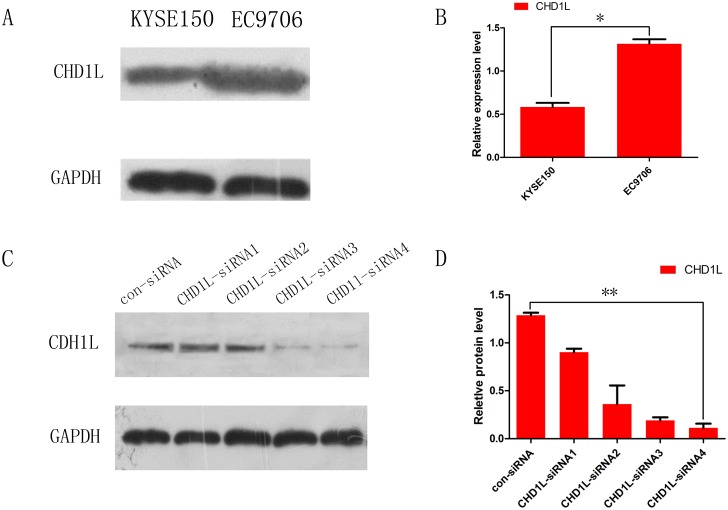
Figure 2. Expression of CHD1L in EC cell lines and inhibition of CHD1L expression by RNA interference.
(A) Western blot analysis of expression of CHD1L in EC cell lines (KYSE 150 and EC9706). (B) The bar chart demonstrates the ratio of CHD1L protein to GADPH for the above data by densitometry. The data are reported as the mean±SD of three independent experiments.(*P<0.05) (C and D) CHD1L expression was analyzed by Western blotting after EC cells were transfected with CHD1L-siRNA; CHD1L-siRNA4 achieved the most complete downregulation effect. (**P<0.01) The combination of CHD1L-siRNA4 and control-siRNA were used for all subsequent experiments.

