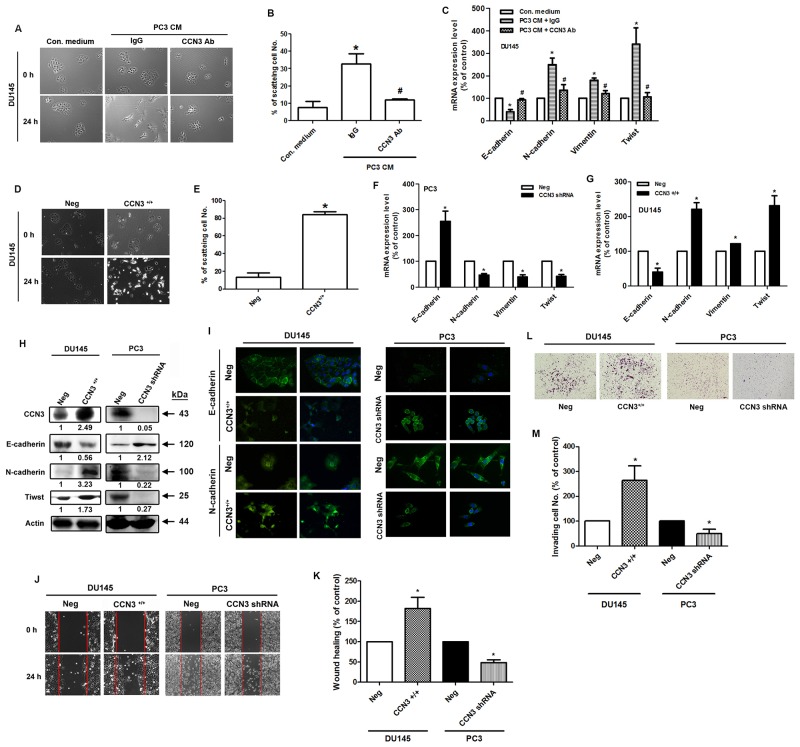
Figure 3. Overexpression or knockdown of CCN3 affects EMT in PCa cells.
(A) The scatter assay was performed on DU145 cells. The cells were incubated with PC3-CM, combined with IgG control or CCN3 neutralizing antibody (1 μg/mL). After 24 h, the DU145 cells were photographed to observe their scattering phenotype. (B) The quantitative analysis of scatter assay which was performed in Figure 3A. (C) The DU145 cells were treated as described (Figure 2A), total mRNA was extracted and the expression levels of E-cadherin, N-cadherin, vimentin, and Twist were determined by qPCR. (D) DU145 cells stably expressing the CCN3 overexpression vector (CCN3+/+) or control vector (Neg) were established. The scatter assay was performed on DU145 stable cells and the cells were photographed to examine their scattering and morphology. (E) The quantitative analysis of scatter assay which was performed in Figure 3D. (F and G) DU145 and PC3 cells stably expressing the CCN3 overexpression (CCN3+/+), CCN3 shRNA vectors (CCN3 shRNA), or control vector (Neg) were established. Total RNA was extracted, and the expression levels of E-cadherin, N-cadherin, vimentin, and Twist were assessed by qPCR. (H) Total proteins were extracted from CCN3+/+ DU145 cells, CCN3 shRNA PC3 cells, and control vector cells. The expression levels of CCN3, E-cadherin, N-cadherin, and Twist were assessed by western blot. Actin was used as internal control. (I) CCN3+/+ DU145 cells, CCN3 shRNA PC3 cells and control vector cells were seeded on glass coverslips. The cells were stained with E-cadherin and N-cadherin antibodies and analyzed by fluorescence microscopy. Nuclei were counterstained with DAPI. Representative microscopy images are shown. (J and K) Wound healing assay was performed on DU145 and PC3 stable cells. The migrating cells were photographed and counted. (L and M) Cell invasion assay was performed on DU145 and PC3 stable cells. The invading cells were photographed and counted. Results are expressed as the mean ± S.E.M. *p < 0.05 compared with Neg group.

