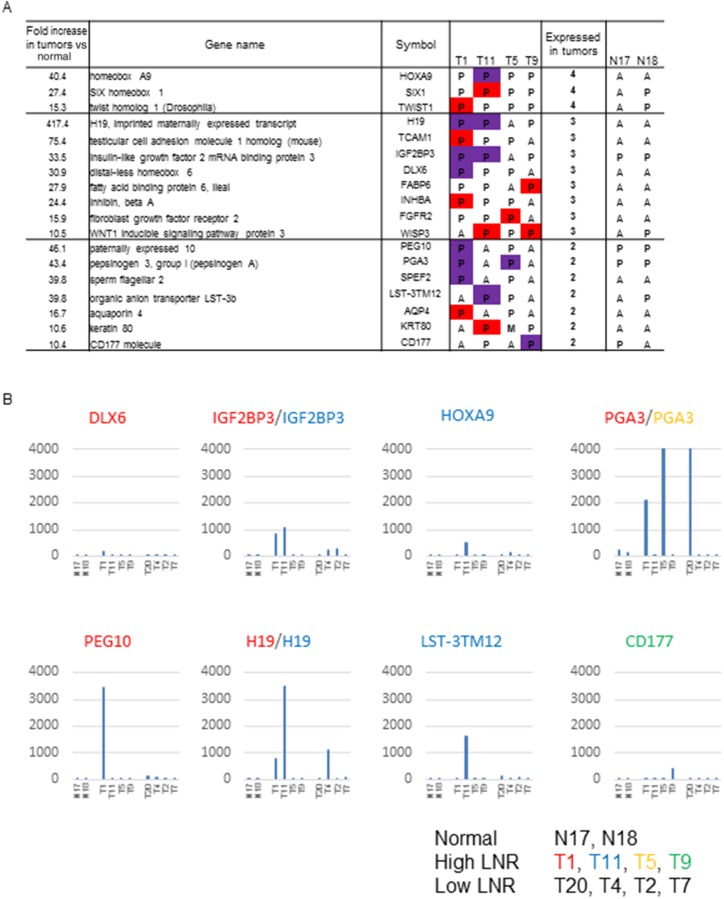
Figure 2. Genes identified as strongly associated with a high LNR in the expression microarray.
(A) Genes in the second, third, and fourth priority groups showing a high expression in tumors. The table shows tissue specimens with raw expression of 100 to 200 in red, and ≥ 200 in purple, in the comparison of GC patients with high and low LNRs. P: present, M: marginal, A: absent in expression by microarray. (B) Gene expression values of candidate high LNR-associated genes with FI > 200 in tumor tissue from GC patients with high LNRs (n = 4) (T1, T11, T5, T9; middle group of patients), low LNRs (n = 4) (T20, T4, T2, T7; patient group on the right), and controls (non-cancerous tissue; n = 2) (N17, N18; first two patients). Raw microarray data (uncorrected). The β-catenin signal was reproduciblefrom approximately 4,000 to 10,000. The color of the gene name corresponds to each patient with a high LNR.

