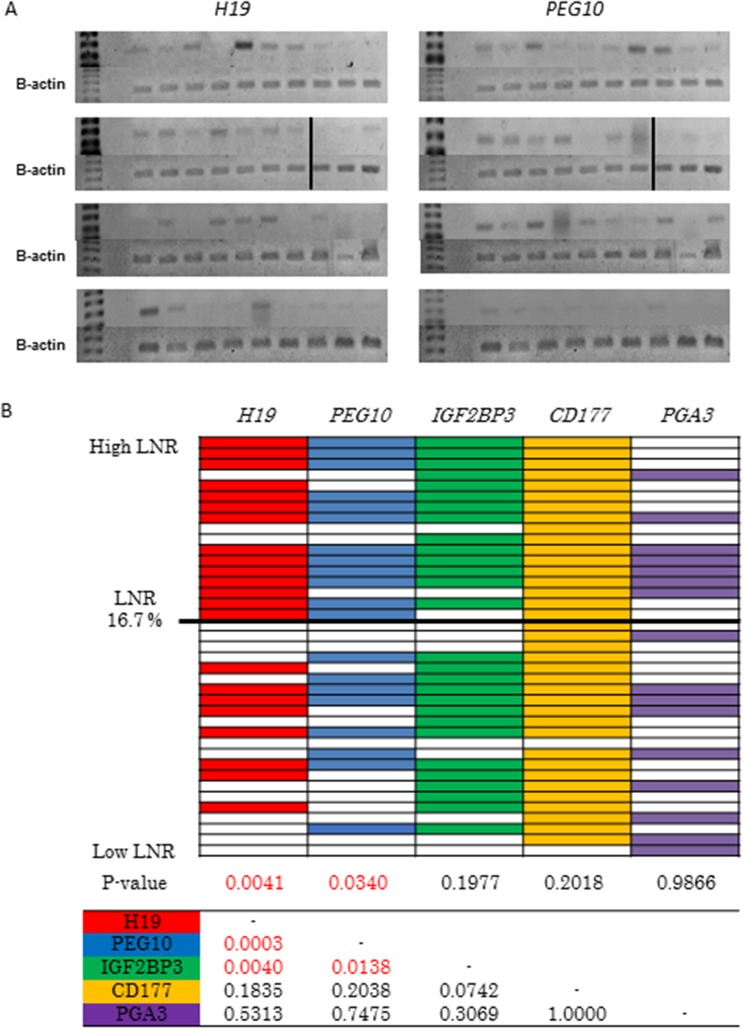
Figure 3. Selection of candidate high LNR-associated genes.
(A) Analysis of H19 and PEG10 expression in pStage III GC tissue samples using RT-PCR. Patients are shown in descending order from the upper left to the lower right according to LNR. (B) RT-PCR analysis of the expression of the five candidate high LNR-associated genes in pStage III GC. Patients are shown in descending order from top to bottom according to LNR. Color indicates positive and white indicates negative. P values were calculated using Fisher's exact or chi-square tests. The table shows the relationship between the five candidate genes.

