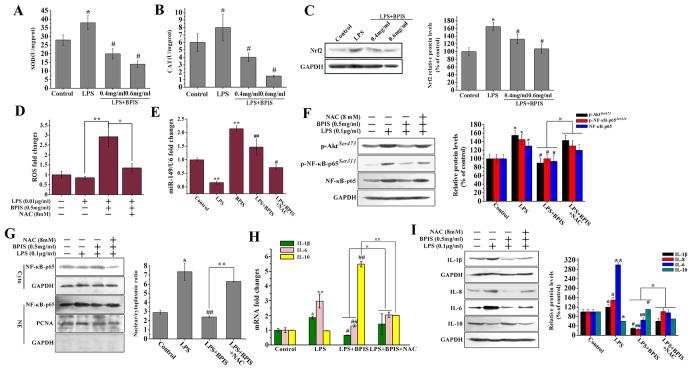
Figure 5. BPIS accelerated ROS production against inflammatory response in HT-29 cells.
(A-C) Cells untreated and treated with 0.01ug/ml LPS alone or treated by adding 0.01 ug/ml LPS with 0.4 mg/ml BPIS and 0.6 mg/ml BPIS. The SOD and CAT activities were measured by enzyme activity testing. The protein expression levels of Nrf2 were measured by western blot. Columns were expressed as mean ± SEM (n = 3, *p<0.05 vs. control, # p<0.05 vs. LPS). (D) Cells untreated and treated with 0.01ug/ml LPS alone or treated by adding 0.01 ug/ml LPS with 0.5 mg/ml BPIS and 8 mM NAC (ROS inhibitor). The ROS generation was measured by microplate reader assay. Each bar represents the mean ± S.D. of three independent experiments. *p<0.05, **p<0.01. (E) qRT-PCR analysis of miRNA -149 expression in treated 0.01ug/ml LPS or 0.5 mg/ml BPIS alone cells and treated by adding 0.01ug/ml LPS with 0.5 mg/ml BPIS cells or pre-incubated with 8 mM NAC 30 min before adding LPS with BPIS cells for 24 h. Columns were expressed as mean ± SEM (n = 3, **p<0.01 vs. control, # p<0.05 vs. LPS, ## p<0.01 vs. LPS). (F) Cells were pre-incubated with 8 mM NAC 30 min before adding 0.01ug/ml LPS with 0.5 mg/ml BPIS for 24 min. Western blot analysis was performed to determine Akt phosphorylation, NF-κB-p65 phosphorylation and NF-κB-p65. Columns were expressed as mean ± SEM (n = 3, *p<0.05 vs. control, # p<0.05 vs. LPS, ×p<0.05). (G) Cells were pre-incubated with 8 mM NAC 30 min before adding 0.01ug/ml LPS with 0.5 mg/ml BPIS for 24 h. Western blot assays of NF-κB-p65 expression in nuclear and cytosolic. PCNA and GAPDH were the loading controls, and the absence of GAPDH in nuclear extracts indicated no cytoplasmic protein. Columns were expressed as mean ± SEM (n = 3, *p<0.05 vs. control, ## p<0.01 vs. LPS, ××p<0.01). (H) qRT-PCR analysis of IL-1β, IL-6 and IL-10 mRNA in treated LPS alone cells and treated by adding LPS with 0.5 mg/ml BPIS cells or pre-incubated with 8 mM NAC 30 min before adding 0.01ug/ml LPS with 0.5 mg/ml BPIS cells for 24 h. (I) Cells were incubated with 0.5 mg/ml BPIS in presence or absence of 8 mM NAC and stimulated with 0.01ug/ml LPS for 24 h. The protein expression levels of IL-1β, IL-6, IL-8 and IL-10 were measured by western blot. Columns were expressed as mean ± SEM (n = 3, *p<0.05 vs. control, **p<0.01 vs. control, # p<0.05 vs. LPS, ## p<0.01 vs. LPS, ×p<0.05).

