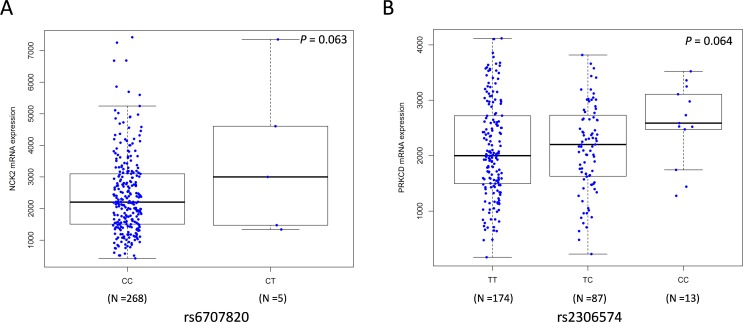
Figure 3. Correlations between SNPs and mRNA expression levels of NCK2 and PRKCD.
Analyses of mRNA expression levels by genotypes of NCK2 rs6707820 (A) and PRKCD rs2306574 (B) in an additive genetic model using the data from 284 metastatic melanoma tissues in the TCGA database. The Y-axis shows the normalized mRNA expression level. The boxes represent the median (black middle line) limited by the first (Q1) and third (Q3) quartiles. The whiskers are the upper and lower adjacent values, which indicate the value of Q3+1.5(Q3−Q1) or the maximum value [if it is less than Q3+1.5(Q3−Q1)], and the value of Q1−1.5 (Q3−Q1) or the minimum value [if it is greater than Q3+1.5(Q3−Q1)], respectively.

