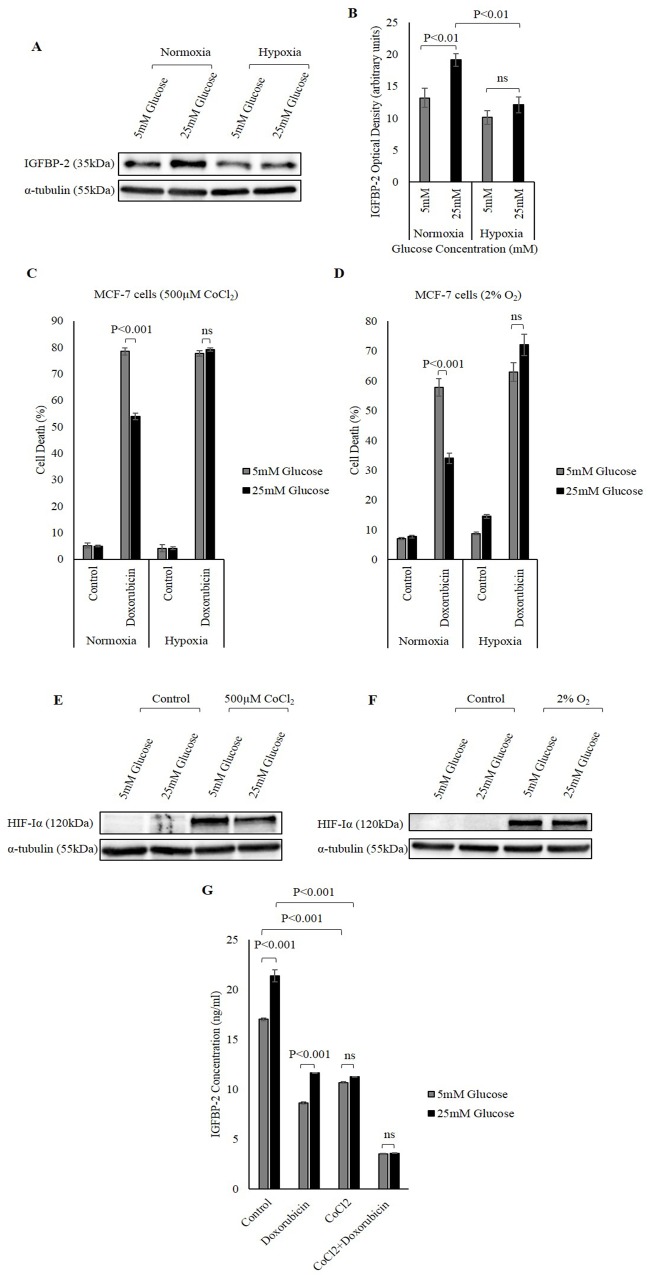
Figure 6. The effect of hypoxia on hyperglycaemia-induced chemo-resistance.
(A) MCF-7 cells were treated with 500μM CoCl2. Changes in the abundance of IGFBP-2 was analysed using Western immunoblotting. (B) Densitometry measurements of IGFBP-2 abundance in normoxic and hypoxic conditions in MCF-7 cells treated in 5mM and 25mM glucose. Hypoxia was chemically-induced in MCF-7 cells by 500μM CoCl2 (C) and b low levels of oxygen (2% O2) (D) in 5mM and 25mM glucose and the cells were treated with 1μM doxorubicin for 24h. The rate of cell death was analysed using a trypan blue dye exclusion assay. HIF-Iα was used as an indicator of successful induction of hypoxia by 500μM CoCl2 (E) and 2% O2 (F) α-tubulin was used as a loading control. (G) Changes in IGFBP-2 concentrations in MCF-7 cells treated in 5mM and 25mM glucose in the presence or absence of 500μM CoCl2 and 1μM doxorubicin determined using ELISA. The graph represents the mean±SEM of three independent repeats each conducted in triplicate.

