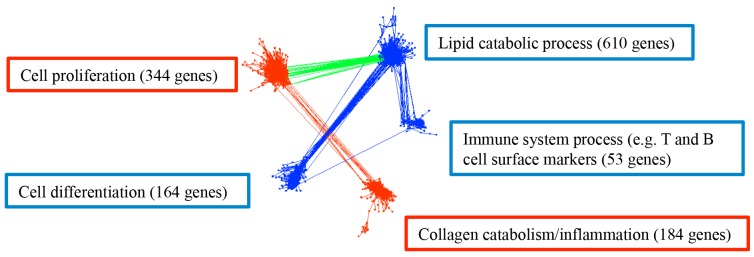
Figure 6. Gene co-expression network in colorectal cancer with 1,355 genes and 54,018 connections.
Upregulated biological processes for the corresponding genes are labeled in red boxes and downregulated biological processes are in blue boxes. Red edges are the connections between upregulated processes, blue edges are the connections between downregulated processes, and green edges are the connections between up- and down-regulated processes. Gene number in each module is presented in each corresponding box. The representative biological processes were determined in DAVID with FDR < 0.05.

