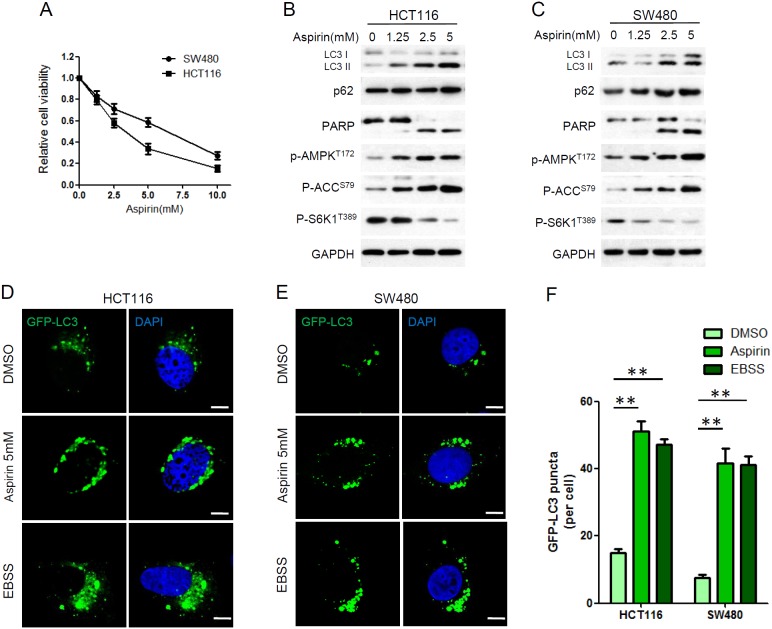
Figure 1. Aspirin inhibited proliferation and induced autophagy in HCT116 and SW480 cells.
(A) Cell viability was determined by CCK8 assay after aspirin treatment at various concentrations (0, 1.25, 2.5, 5, 10 mM) for 72 h. Bars represent mean ± SEM. Three independent experiments (n=3). (B-C) HCT116 and SW480 cells were treated with different concentration of aspirin for 24 h. Protein levels were estimated using western blot analysis. GAPDH was used as loading control. (D-E) HCT116 and SW480 cells were transfected with GFP-LC3 plasmid for 24 h. Then the cells were treated with 5mM aspirin or DMSO for 24h or EBSS for 4h, followed by confocal fluorescence microscopy. Scale bar, 5μm. Data represents three independent experiments. (F) Quantitation of GFP-LC3 puncta in D and E. Bar are mean ± SEM of 50 cells; three independent experiments, **P< 0.01 (Student’s t-test).

