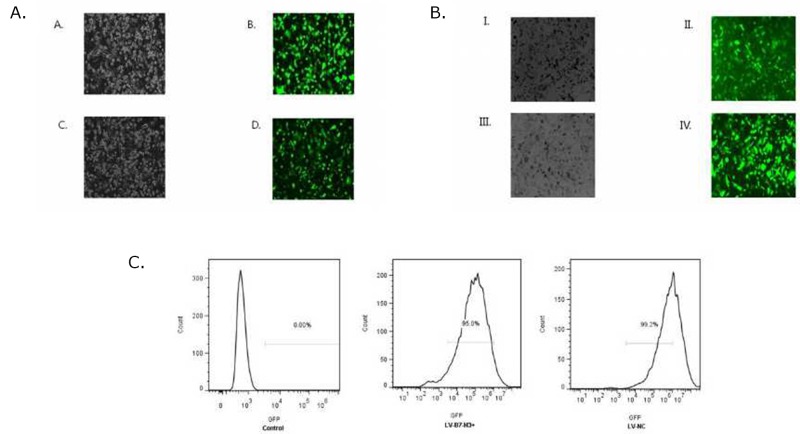
Figure 7.
(A) Patu8988 cells displaying bright-field and green fluorescence (original magnification: 100×). (A and B) White light and green fluorescence of shB7-H3/Patu8988 cells. (C and D) White light and green fluorescence of LV-NC-/Patu8988 cells. (B) Panc-1 cells displaying bright-field and green fluorescence (original magnification: 100×). (I and II) White light and green fluorescence of LV-B7H3+/Panc-1 cells. (III and IV) White light and green fluorescence of LV-NC+/Panc-1 cells. (C) Expression of GFP was assessed by FCM. Infected positive cell ratio of LV-B7-H3+/Panc-1 and LV-NC+/Panc-1 cells was 95.0% and 99.2%, respectively.

