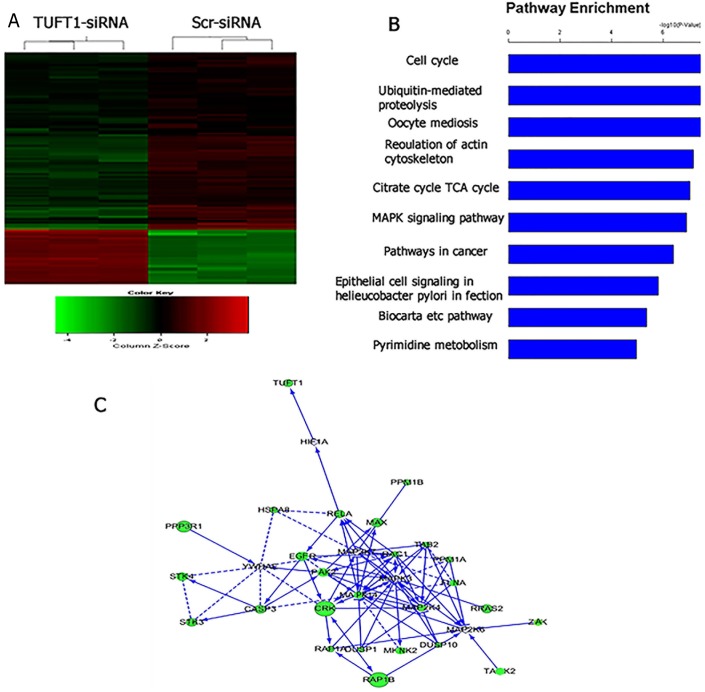
Figure 8. Widespread changes of gene expressions in MDA-MB-231 cells with TUFT1 knockdown by microarray.
(A) Heatmap depicting 1,095 genes that were significantly differentially expressed between cells transfected with scrambledand TUFT1-siRNA based on a P < 0.05. Rows and columns represent transcripts and samples, respectively. Upregulated anddownregulated gene expression is indicated by red and green colors, respectively. (B) Functional pathway analysis of the differentially expressed genes was conducted based on KEGG and BIOCARTA databases. Here, 10 significant-enriched pathways based on a P<0.001 were shown. The statistical significance shown in X axis is represented by the inverse log of the P value. (C) Networks were constructed between TUFT1 and genes involved in KEGG pathway MAPK. Solid arrow in the figure means confirmed regulatory relationships and dotted line means predicted regulatory relationships.

