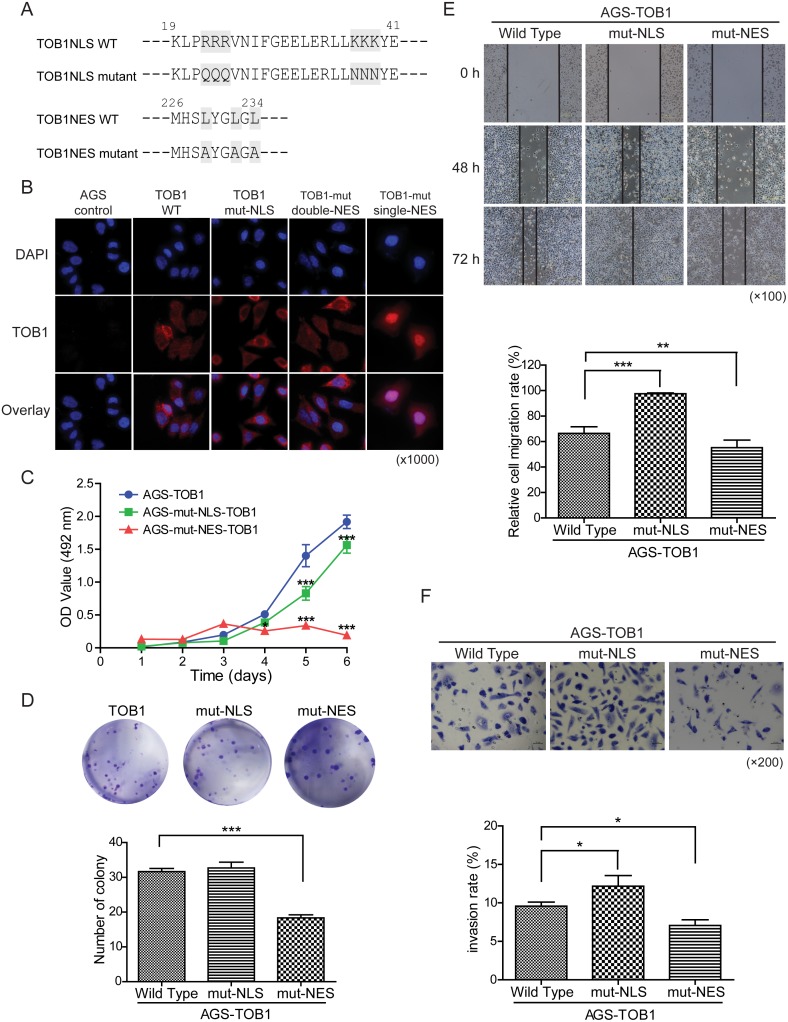
Figure 4. The effects of TOB1 nuclear localization mutants on the malignant potential of AGS cells.
(A) Mutations in the NLS and NES in the TOB1 expression vector. (B) Subcellular localization of the mutant TOB1 variants in tumor cells stained with an anti-Flag antibody. (C) Growth rate of GC cells. (D) Proliferation rate of GC cells. (E) Analysis of GC cell migration at the indicated time points following wound formation. Representative graph showing the percentage of cells that migrated relative to the total. (F) Analysis of GC cell invasion through Matrigel-coated membranes. Representative images and the percentage of invaded cells are shown.

