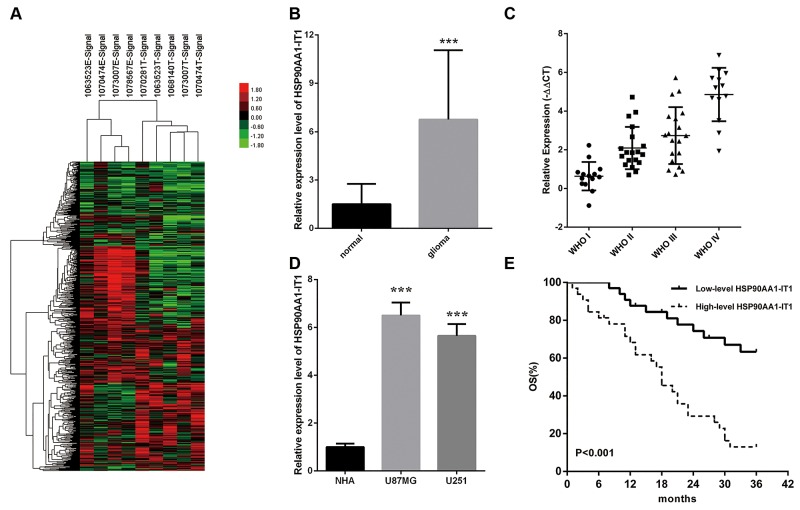
Figure 1. The expression profiles of HSP90AA1-IT1 in the glioma specimens and cell lines.
(A) The differential expression clusters of lncRNAs in the glioma specimens and paracarcinomic tissues were shown using high throughput technologies. The suffix E-Signal represented paracarcinomic tissues, and the suffix T-Signal represented tumor tissues. The red color indicated the upregulated lncRNAs and the green color indicated the opposite. The endogenous expression levels of HSP90AA1-IT1 in 133 clinical glioma specimens in total (B) or classified into four World Health Organization (WHO) grades (C) were determined by qRT-PCR. Data were presented as mean ± s.d. from three independent experiments. ***P < 0.001 vs. results of the normal brain tissues. (D) The expressions of HSP90AA1-IT1 in the two glioma cell lines were tested by qRT-PCR compared to normal astrocytes (NHA). Each bar represents mean ± s.d. from three independent experiments. ***P < 0.001 vs. NHA. (E) The overall survival of the 65 glioma patients were recorded based on low or high expression levels of HSP90AA1-IT1.

