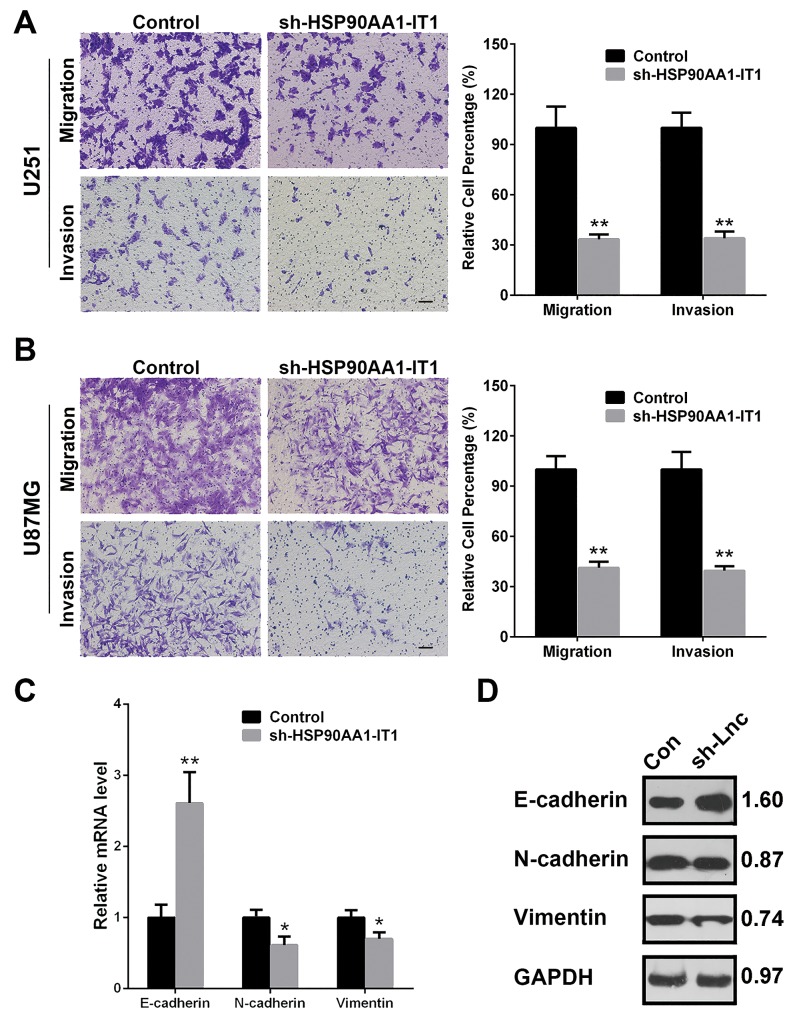
Figure 3. Effects of HSP90AA1-IT1 on the migration/invasion of the glioma cells.
The U87MG and U251 glioma cells were infected with lentiviruses expressing sh-HSP90AA1-IT1. Lentiviral vector with nonspecific shRNAs was taken as the NC. (A, B) Cell migration and invasion were determined by transwell assay. Each bar represents mean ± s.d. from three independent experiments. *P < 0.05 vs. NC, **P < 0.01 vs. NC. The mRNA (C) and protein (D) levels of the representative EMT markers including E-cadherin, N-cadherin and Vimentin were measured by qRT-PCR and Western Blotting analyses respectively. GAPDH was used as an internal control. The results represent mean ± s.d. from three independent experiments. *P< 0.05 vs. NC, **P< 0.01 vs. NC. Scale: 20μm.

