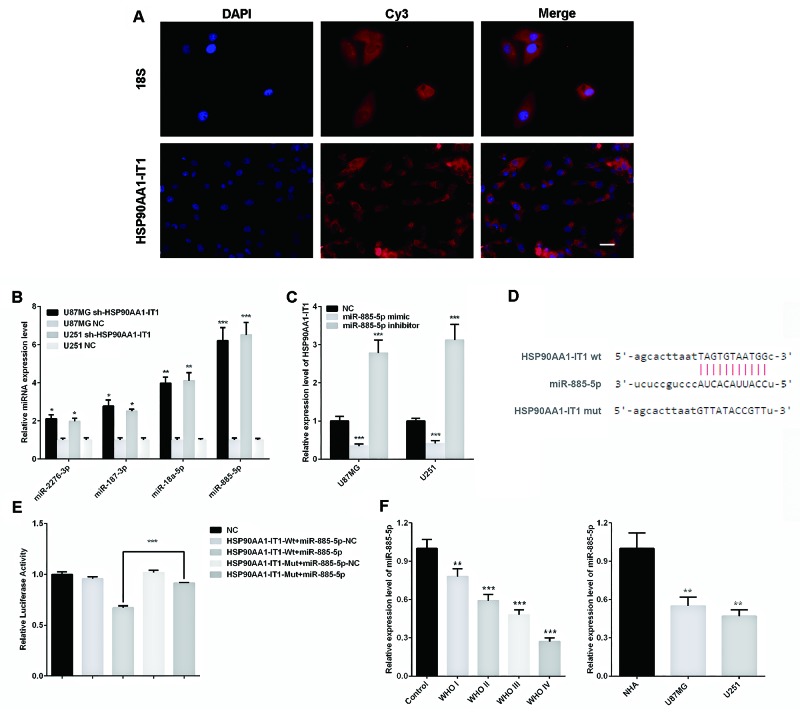
Figure 4. Reciprocal repressions between HSP90AA1-IT1 and miR-885-5p.
(A) Fluorescence in situ hybridization (FISH) assay showed that lncRNA HSP90AA1-IT1 mainly located in the cytoplasm of the glioma cells. Human 18S was used as an internal control. The lncRNA HSP90AA1-IT1 and h-18S were stained red by Cy3, and the nucleus were stained blue by DAPI. (B) The U87MG and U251 glioma cells were infected with lentiviruses expressing sh-HSP90AA1-IT1. Lentiviral vector with nonspecific shRNAs was taken as the NC. The expression levels of four potential miRNAs targeted on HSP90AA1-IT1 were determined by qRT-PCR. Data were presented as mean ± s.d. from three independent experiments. *P < 0.05 vs. NC, **P < 0.01 vs. NC, ***P < 0.001 vs. NC. (C) The U87MG and U251 glioma cells were transfected with miR-885-5p mimic or inhibitor. Non specific RNA oligonucleotides were taken as the NC. The expression levels of HSP90AA1-IT1 were tested by qRT-PCR. The results represent mean ± s.d. from three independent experiments. ***P < 0.001 vs. NC. (D) The potential binding sequence between HPS90AA1-IT1 and miR-885-5p was shown based on the target prediction analysis. (E) Relative luciferase activities were determined by dual-luciferase reporter assay. Data were presented as mean ± s.d. from three independent experiments. ***P < 0.001 vs. NC. (F) The endogenous expression levels of miR-885-5p in 133 clinical glioma specimens classified into four WHO grades and two glioma cell lines were determined by qRT-PCR. Each bar represents mean ± s.d. from three independent experiments. **P < 0.01 vs. results of the normal brain tissues (normal)/ astrocytes (NHA), ***P < 0.001 vs. normal/NHA. Scale: 20μm.

