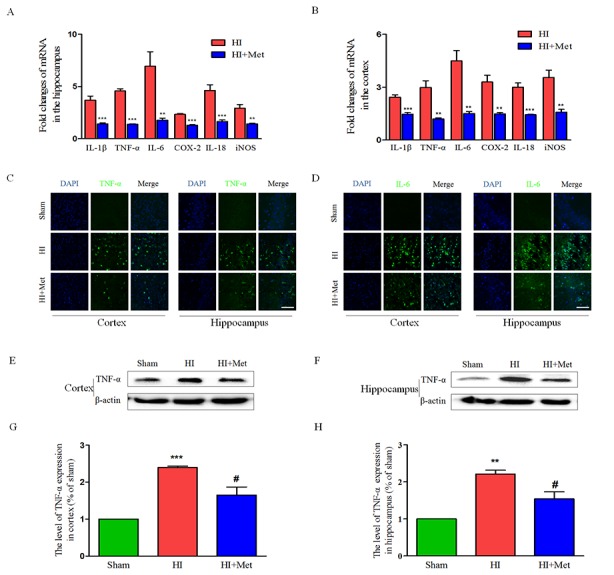
Figure 6. Metformin treatment decreased the expression of inflammatory factors at both the mRNA and protein levels.

The levels of mRNA expression in cortex (B) and hippocampus (A) at 24 h after HI injury are reported as the value normalized to β-actin for each sample. **P < 0.01, ***P < 0.001 versus HI group. Values represent the mean±SEM, Number of animals. n=5 for each group. (C) Representative micrographs showing immunofluorescence staining of TNF-α (green) in the hippocampus and cortex, and nucleus (blue) was labeled with DAPI. Scale bar = 50 μm. (D) Representative micrographs showing immunofluorescence staining of IL-6 (green) in the hippocampus and cortex, and nucleus (blue) was labeled with DAPI. Scale bar = 50 μm. Representative western blots and quantification data of TNF-α in cortex (E and G) and hippocampus (F and H) at 24 h after HI injury. **P < 0.01, ***P < 0.001 versus the sham group. #P < 0.05 versus the HI group. Values represent the mean±SEM, Number of animals. n=5 for each group.
