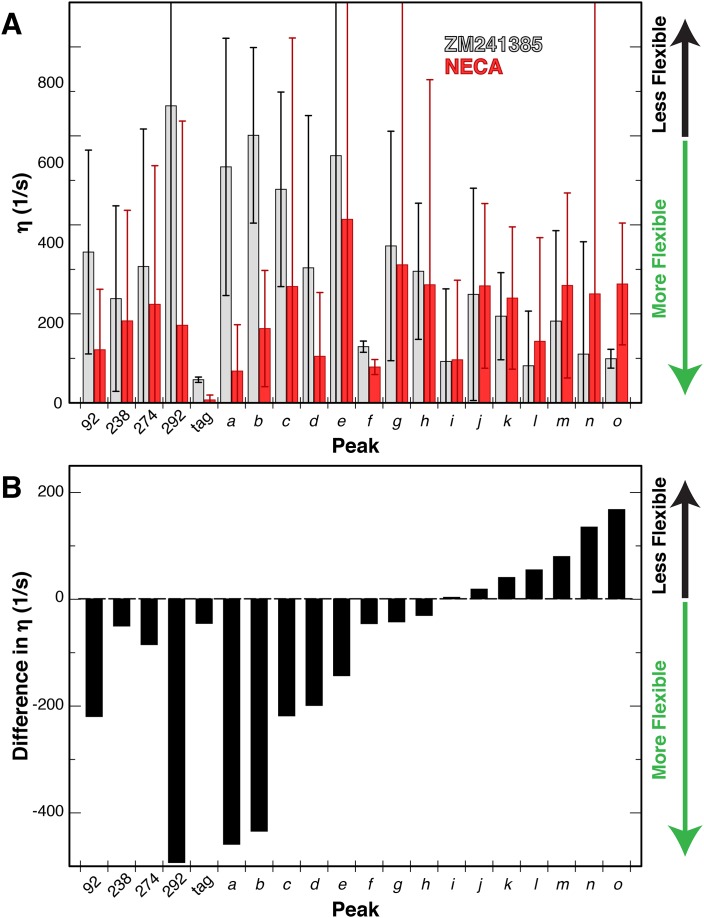
Figure 6. Changes in dynamics of methyl groups of A2AR in the presence of different ligands.
(A) Plot of the 1H-1H dipolar cross-correlation rateη, which is proportional to the S2axis order parameter, for 20 peaks in the Ile δ1 region for A2AR in DDM micelles with agonist NECA (red) and inverse agonist ZM241385 (grey). A higher η value corresponds to more rigid methyl groups. Error bars show bootstrap errors of the fit parameters, propagated from the noise of the NMR spectra. Assigned peaks are on the left of the plot, unassigned on the right. Peak IDs correspond to those in Figure 3A. (B) Plot of the ligand-induced differences (Δη = η[NECA] – η[ZM241385]) for 20 peaks in the Ile δ1 region for A2AR in DDM micelles. Negative Δη values, which are observed for the majority of peaks, indicate increased motions in the presence of agonist. Assigned peaks are on the left of the plot, unassigned on the right. Peak IDs correspond to those in Figure 3A.


