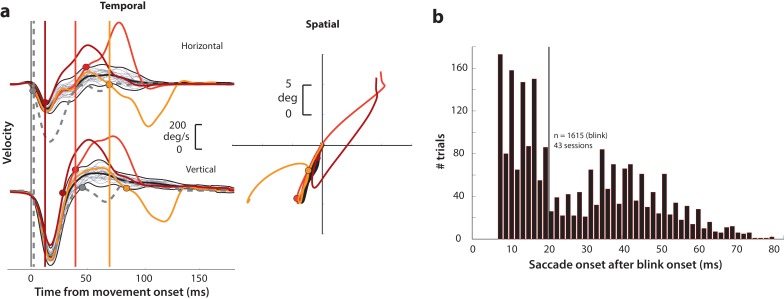
Figure 2. Determining goal-directed saccade onset in blink-triggered eye movements.
(a) Left column: horizontal (top row) and vertical (bottom row) eye velocity profiles during blink-related eye movements obtained during fixation (BREMs, thin gray traces) and three example blink-triggered saccadic eye movements (colored traces) from one session. The thick black trace in the middle of the BREM profiles is their mean and the two black traces above and below it are 2.5 s.d. bounds. Saccade onset was determined to be the point where an individual velocity profile (colored traces) crossed the BREM bounds and stayed outside for 15 consecutive time points. This point was determined independently for the horizontal and vertical channels (colored circles corresponding to each trace in the two rows), and the earlier time point was taken as the onset of the overall movement (vertical colored lines). The dashed gray velocity profile that deviates from the BREM very close to movement onset (<5 ms) is shown to highlight a case where the saccade starts before being perturbed by the blink, and was not considered as a blink-triggered movement in this study. Right column: Spatial trajectories of the eye for the three example blink-triggered movements from the left column, with the corresponding saccade onset time points indicated by the circles. The trajectory of the BREM template is shown in black (for the sake of clarity, only the mean is shown). Note that the movements in this session were made to one of two possible targets on any given trial. (b) Distribution of goal-directed saccade onset times relative to overall movement onset for blink-triggered movements (n = 1615) across all sessions (n = 43). For the motor potential and accumulation rate analyses (Figures 4–5 and 7), we only considered movements where the blink-triggered saccade started at least 20 ms after overall movement onset (to the right of the vertical line). For the threshold analysis (Figure 6), we considered all blink-triggered movements.

