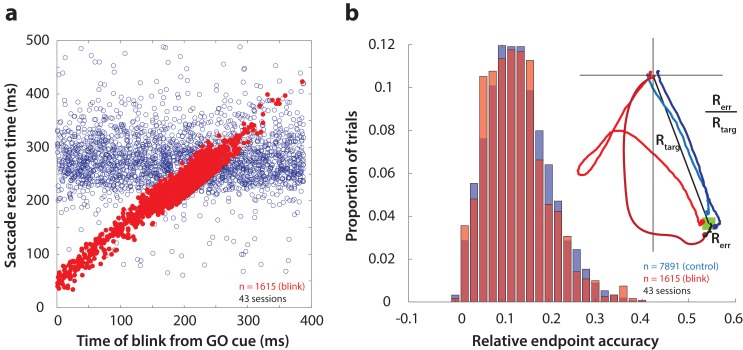
Figure 3. Time course and accuracy of blink-triggered saccades.
(a) Saccade reaction time as a function of blink onset time across all trials (n = 7891 control trials, 1615 blink trials) and sessions (n = 43). Red filled circles are individual blink trials, and blue circles are from control trials with randomly assigned blink times for comparison. For visualization alone, only a random selection of control trials equal in number to blink trials are plotted. (b) Endpoint accuracy for control and blink-triggered movements (blue and red histograms, respectively) across all trials from all sessions. To enable comparison across movement amplitudes, the endpoint error was normalized as the actual Euclidean endpoint error from the target divided by the eccentricity of the target, as depicted in the spatial plot in the inset.

