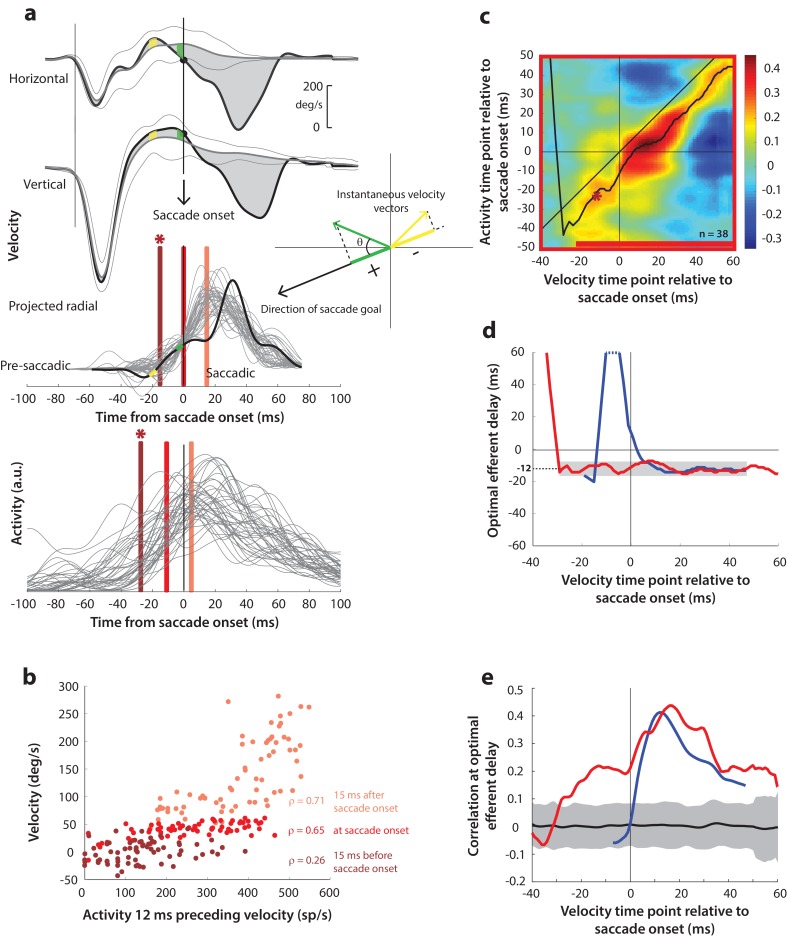
Figure 5. Motor potential on blink trials.
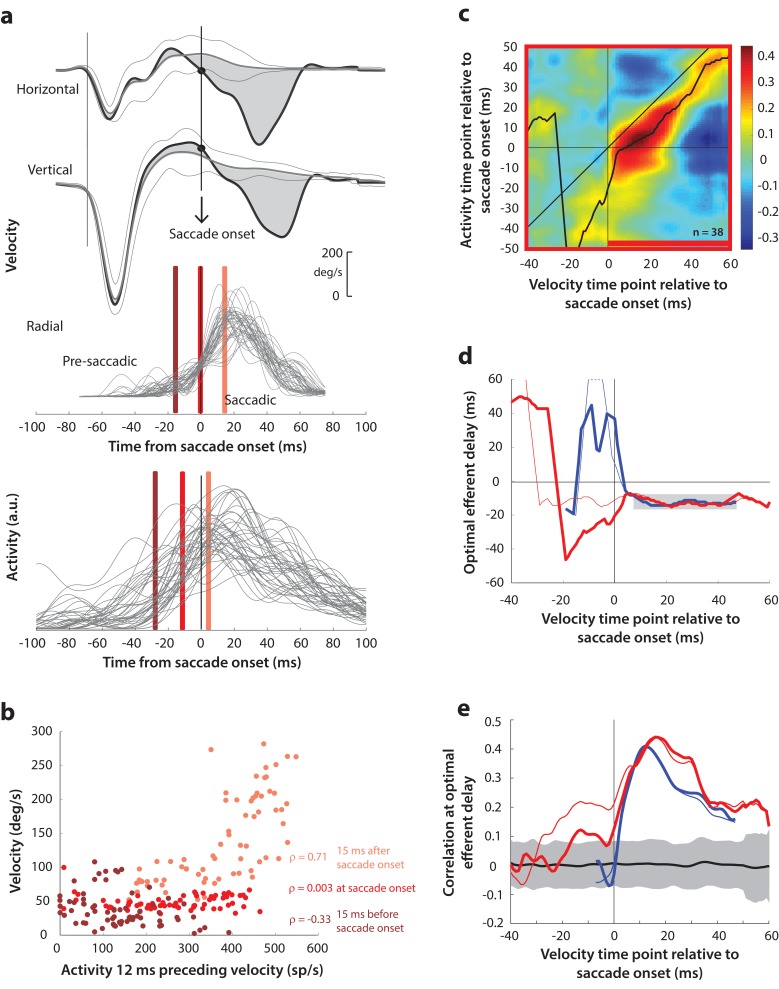
(a) Computation of the kinematic variable for blink-triggered movements. Horizontal and vertical velocities (thick black traces in top two rows) are converted to residual velocities (gray fill) after subtracting the corresponding mean BREM template (middle thin black trace in top two rows), in order to discount the effects of intrinsic variability in the BREM itself. The radial residual velocity (third row) in the direction of the saccade goal is then computed, similar to Figure 4a. The green and yellow time points in the velocity traces (shown as thicker than an instant for clarity), represented as corresponding velocity vectors in the inset, illustrate this process. For example, the green velocity residual, immediately before saccade onset, deviates negatively from the BREM in the horizontal component, and positively in the vertical component, resulting in an instantaneous kinematic vector pointing leftwards and upwards. The component of this vector in the direction of the saccade goal is then taken as the kinematic variable for this time point (also compare Figure 5—figure supplement 1). (b) Scatter plot of the neural activity versus velocity at the three indicated time points (red points of various saturation, at corresponding red lines in panel a) for blink-triggered movements. As in Figure 4b, these are plotted at the −12 ms shift between activity and velocity Note the strong correlation for pre-saccade time points compared to Figure 4b. (c) Point-by-point correlation of projected residual velocity with activity, averaged across neurons, for blink-triggered movements. The velocity time points are with respect to time of saccade onset extracted from the blink-triggered movement. The dark red asterisk points to the correlation between the velocity and activity corresponding to the time points with the asterisk in panel a. The black curve traces the contour of the highest correlation time points in the activity for each point during the movement. The red bar at the bottom of the heatmap indicates timepoints at which the average correlation was significant (based on 95% CI from panel e). (d) Optimal efferent delay computed as the distance of the black trace in panel c from the unity line. The red trace is for blink-triggered movements, and the blue trace is from Figure 4d for control saccades, overlaid for comparison. Negative values for the delay are causal, i.e., correlation was high for activity points leading the velocity points. The gray bar highlights the fact that the optimal delay was consistent during both control and blink-triggered saccades, and both before and after saccade onset for the latter (mean for shaded region = −12 ms). (e) Population average correlation for blink-triggered movements (red trace) as a function of time at the −12 ms estimated efferent delay. The blue trace is from Figure 4e for control saccades, overlaid for comparison. The black trace is the mean and the gray region is the 95% confidence interval for the bootstrapped (trial-shuffled) correlation distribution.


