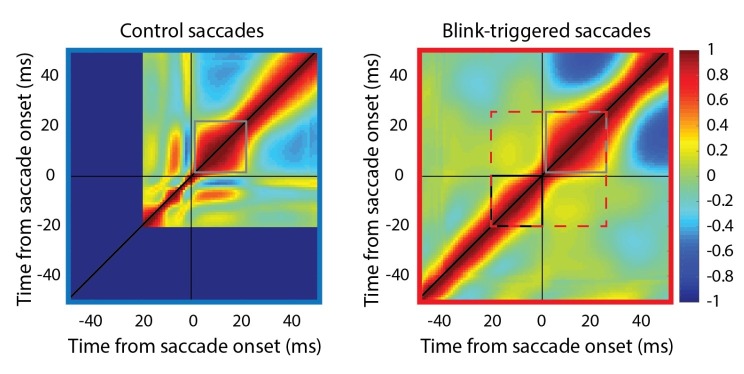
Author response image 2. Self-correlation of velocity profiles.
Left – Across-trial correlated variability of instantaneous velocity on control trials. These correlations are computed similarly to the activity-velocity correlations in Figures 4C and 5C, except with the activity replaced by velocity. Smooth and continuous velocity profiles result in a window of high correlations (gray square) where the velocity values are correlated amongst themselves. Right – For blink trials, the velocity profiles are correlated with each other over time after saccade onset (gray square), and separately, before saccade onset (black square, during the epoch of preparatory motor potential), with a discontinuity in between (narrowing of correlations along the diagonal). It is important to note that the correlation between pre-saccade and post-saccade velocities is not nearly as strong (if they were, one would expect a window of high correlations marked by the dashed red square). Moreover, if saccade onset were over- or under- estimated, either the black or gray windows should’ve crossed the zero point.

