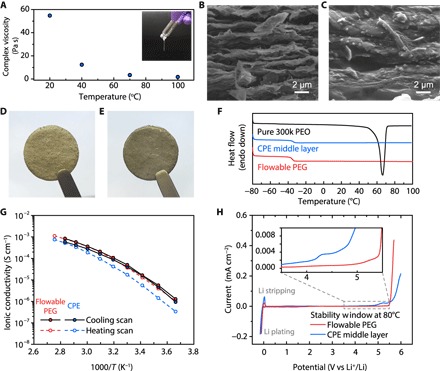
Fig. 2. Characterizations of the flowable PEG and the CPE middle layer.

(A) Complex viscosity of the flowable PEG as a function of time at 10 Hz obtained via rheology measurements. Inset: Digital photo image of the flowable PEG at room temperature. SEM and digital photo images of the 3D Li-rGO anode (B and D) before and (C and E) after thermal infiltration of the flowable PEG. (F) DSC thermograms of pure PEO, CPE middle layer, and flowable PEG. The endothermic peak of pure PEO at ~65°C corresponds to the melting of crystalline PEO. Ionic conductivity (G) and electrochemical stability window (H) of the flowable PEG and the CPE middle layer. The CV scans for the determination of the electrochemical stability windows were carried out at a scan rate of 0.1 mV s−1.
