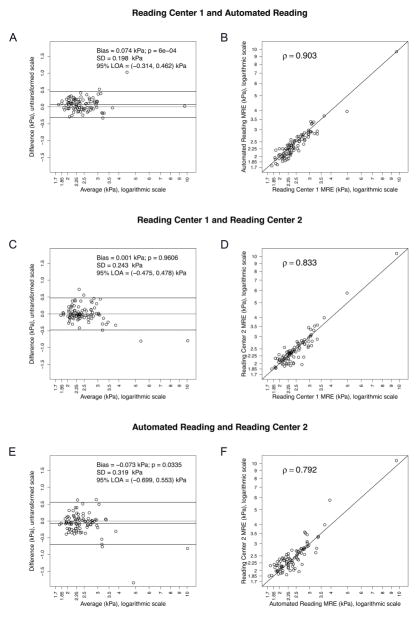
Figure 2.
Bland-Altman plots and scatterplots for each pair of elastorgram analysis methods. Logarithmic scale is used to plot raw and averaged MRE values for better visibility. Bland-Altman Bias (mean of the paired differences) and its p-value (p-value for a paired t-test), standard deviation (SD) of the differences, and the limits of agreement (LOA = Bias+/− 1.96*SD), are shown on the Bland-Altman plots A, C and E. Spearman’s correlation coefficient is shown on the scatterplots B, D and F.

