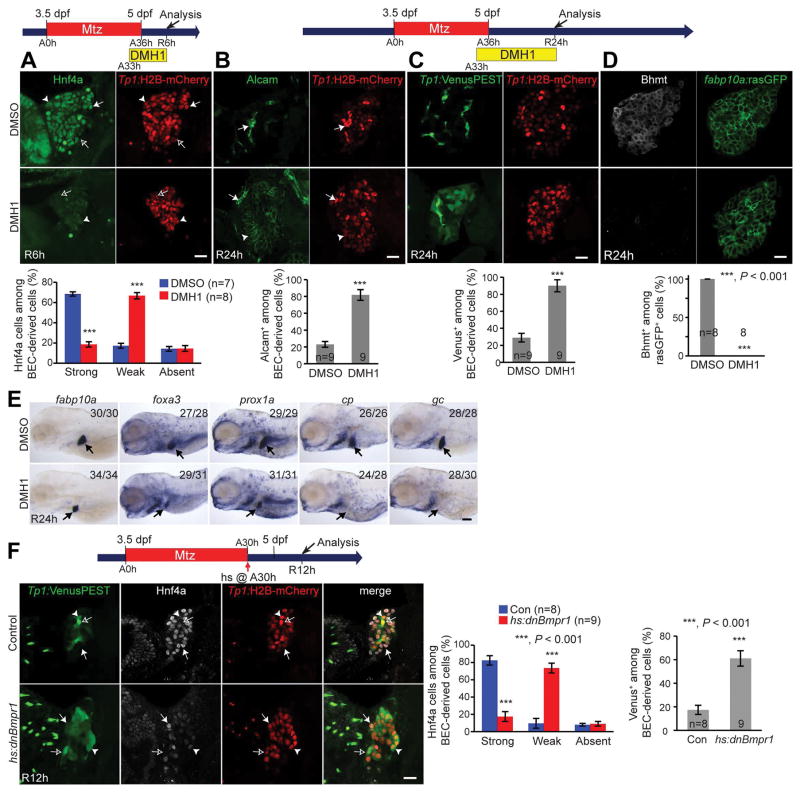
Figure 2. Bmp inhibition blocks HB-LC differentiation into hepatocytes.
(A) Single-optical section images showing Hnf4a and Tp1:H2B-mCherry expression in regenerating livers. To quantify Hnf4a expression, BEC-derived H2B-mCherry+ cells were divided into three cases: Hnf4astrong (arrows), Hnf4aweak (arrowheads), and Hnf4aabsent (open arrows). Quantification of the percentage of these three cell types among H2B-mCherry+ cells. (B) Single-optical section images showing Alcam and Tp1:H2B-mCherry expression in regenerating livers. In DMH1-treated regenerating livers, Alcam was expressed in both H2B-mCherrystrong (arrows) and H2B-mCherryweak cells (arrowheads), whereas in control regenerating livers, Alcam was expressed only in H2B-mCherrystrong cells. Quantification of the percentage of Alcam+ cells among H2B-mCherry+ cells. (C) Single-optical section images showing the expression of Tp1:VenusPEST and Tp1:H2B-mCherry in regenerating livers. Quantification of the percentage of VenusPEST+ cells among H2B-mCherry+ cells. (D) Single-optical section images showing Bhmt and fabp10a:rasGFP expression in regenerating livers. Quantification of the percentage of Bhmt+ cells among BEC-derived fabp10a:rasGFP+ cells. (E) WISH images showing the expression of fabp10a, foxa3, prox1a, cp and gc in regenerating livers (arrows). (F) Single-optical section images showing Hnf4a, Tp1:VenusPEST, and Tp1:H2B-mCherry expression in regenerating livers. The Tg(hs:dnBmpr1-GFP) line was used to block Bmp signaling via a single heat-shock at A30h. Quantification of the percentage of Hnf4astrong (arrows), Hnf4aweak (arrowheads), and Hnf4aabsent (open arrows) cells and of VenusPEST+ cells among H2B-mCherry+ cells. Scale bars: 20 (A–D, F), 150 (E) μm; error bars: ±SEM.

