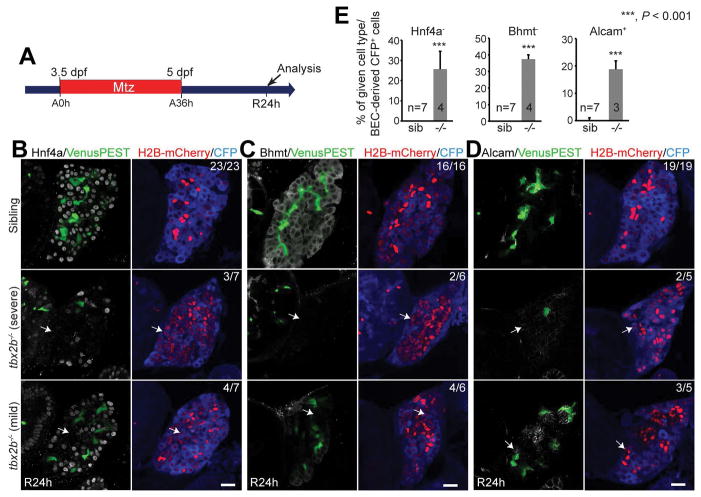
Figure 6. tbx2b mutants exhibit a defect in HB-LC differentiation into hepatocytes.
(A) Experimental scheme illustrating the stage of Mtz treatment and analysis. (B–D) Single-optical section images showing the expression of fabp10a:CFP-NTR, Tp1:VenusPEST, Tp1:H2B-mCherry, and Hnf4a (B), Bhmt (C) or Alcam (D) in regenerating livers. (E) Quantification of the percentage of Hnf4a−, Bhmt−, or Alcam+ cells (arrows) among CFP-NTR+/H2B-mCherry+ cells as shown in B–D. The mild cases were used for quantification. Scale bars: 20 μm; error bars: ±SEM.

