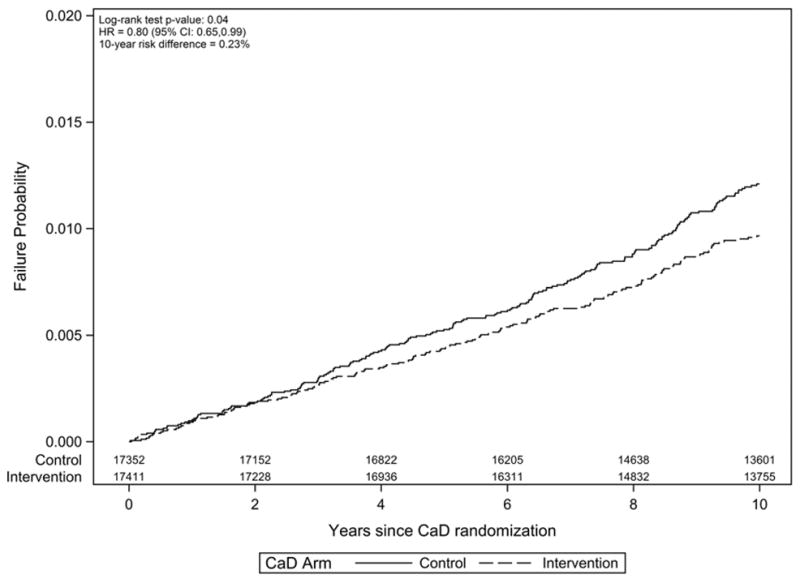
Figure 2. Risk of incident hematologic cancer by calcium / vitamin D (CaD) trial arm.

Kaplan-Meier failure plot (one minus survival) with number-at-risk shown by treatment arm. The risk difference at year 10 reflects the difference in cumulative incidence estimates, with death not attributable to hematologic cancer treated as a competing risk.
